Direct Mail Lists
Super charge your mailing lists.
Read below to see how we pull better mailing lists.
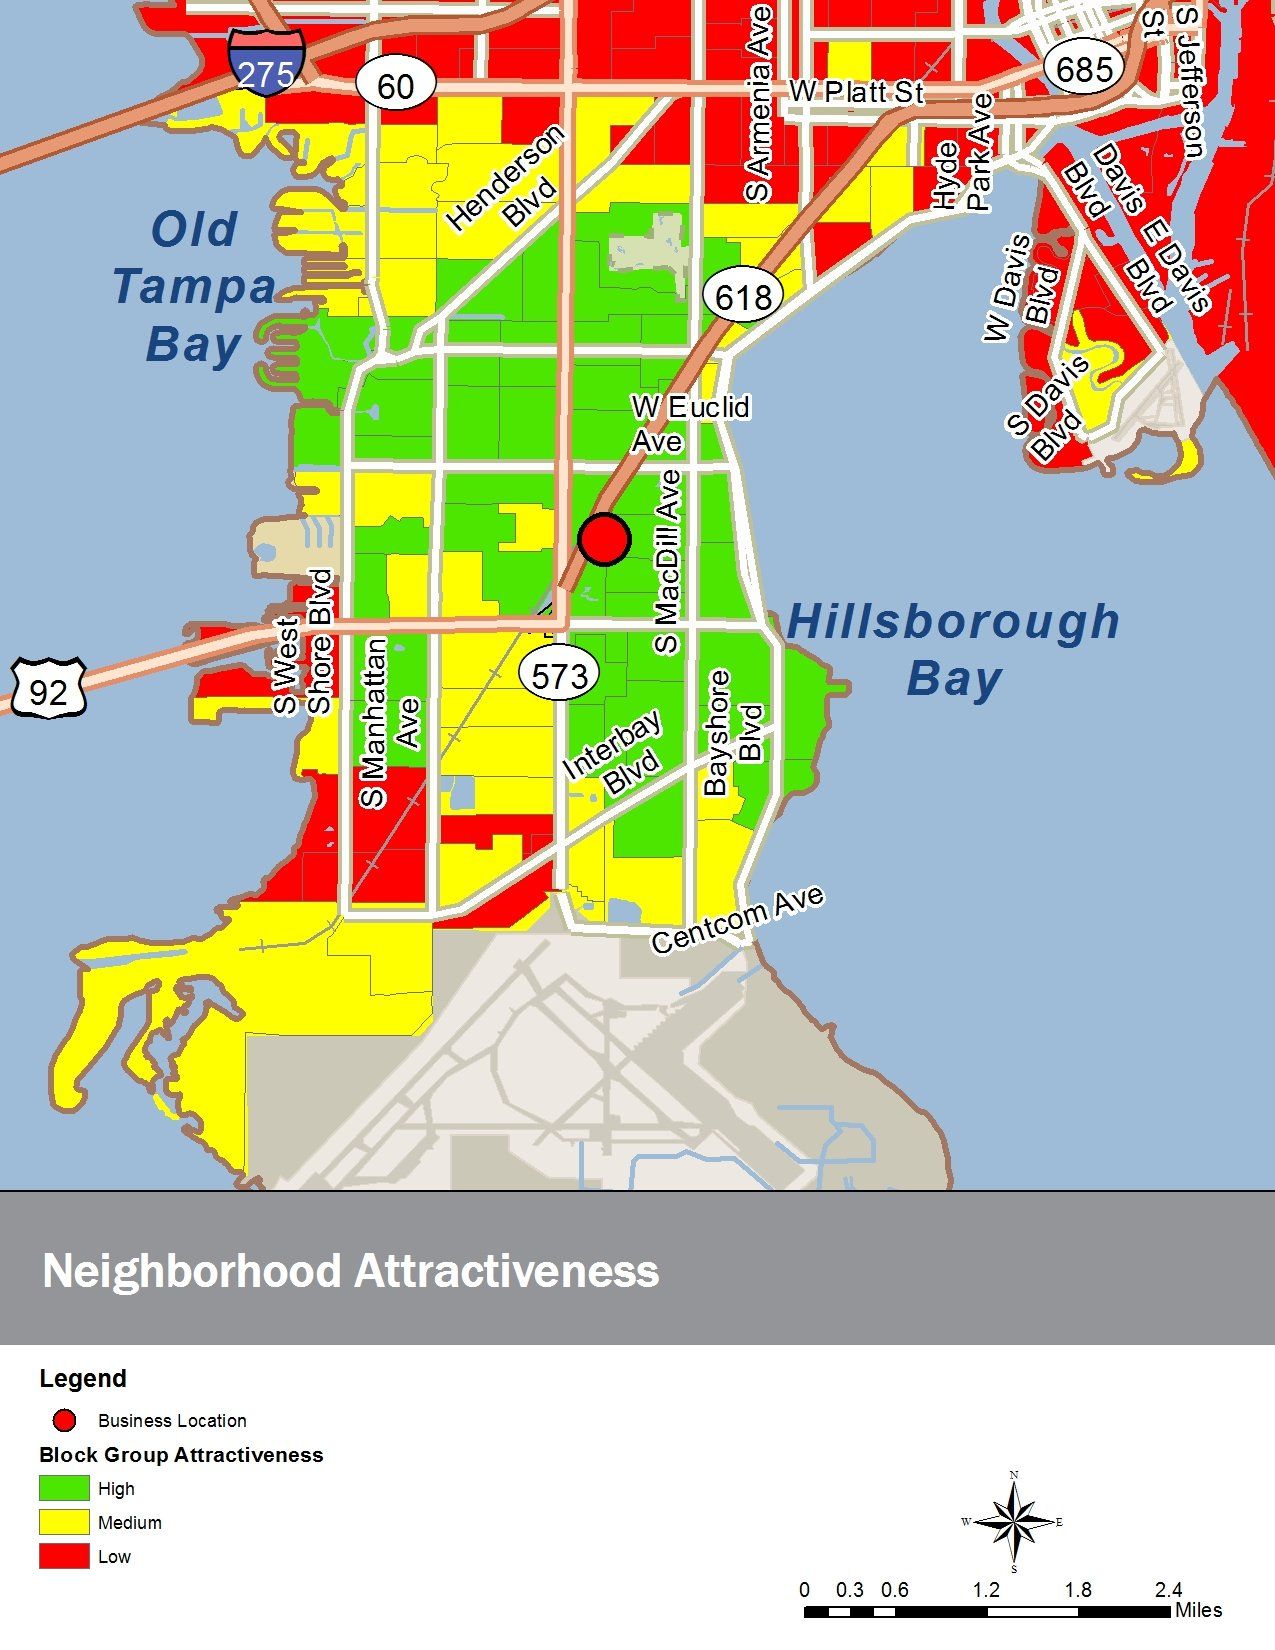
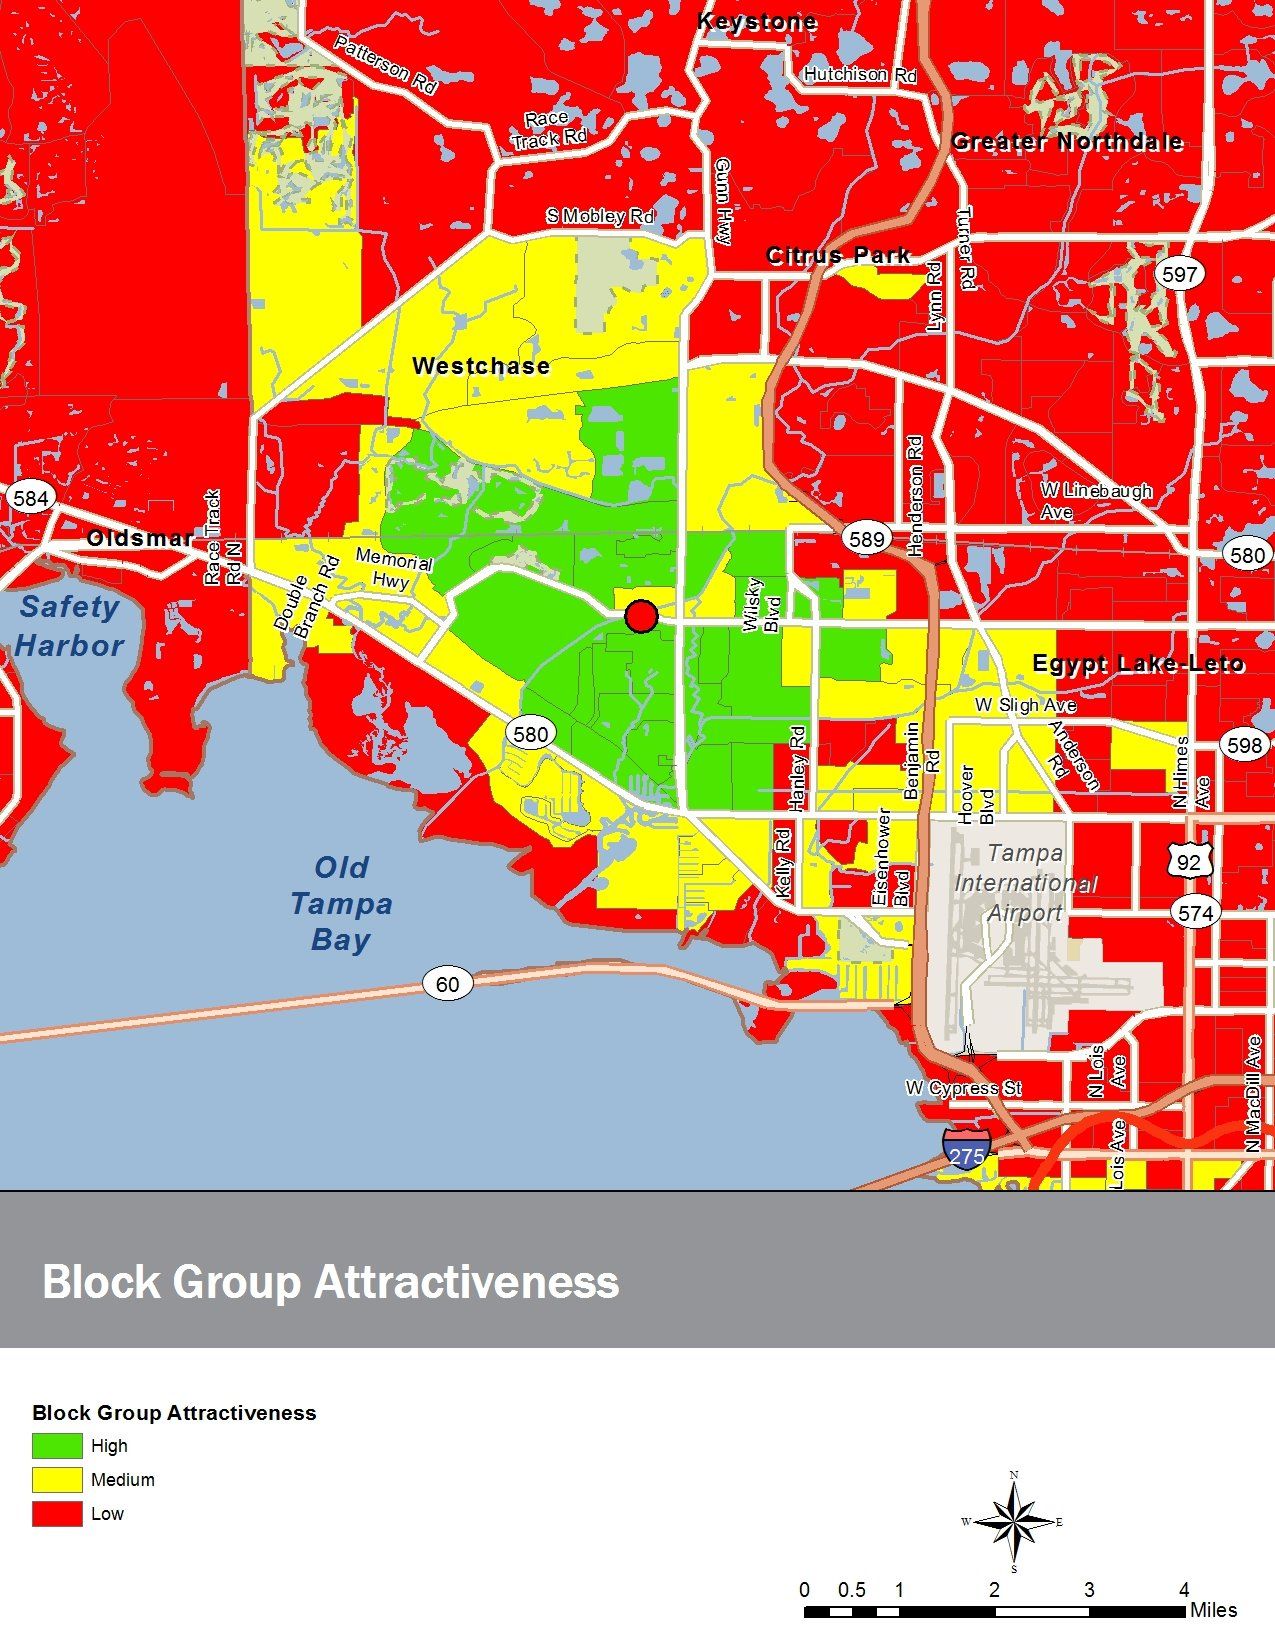
Look: Easily drag the line across the map to see how we establish neighborhood attractiveness.
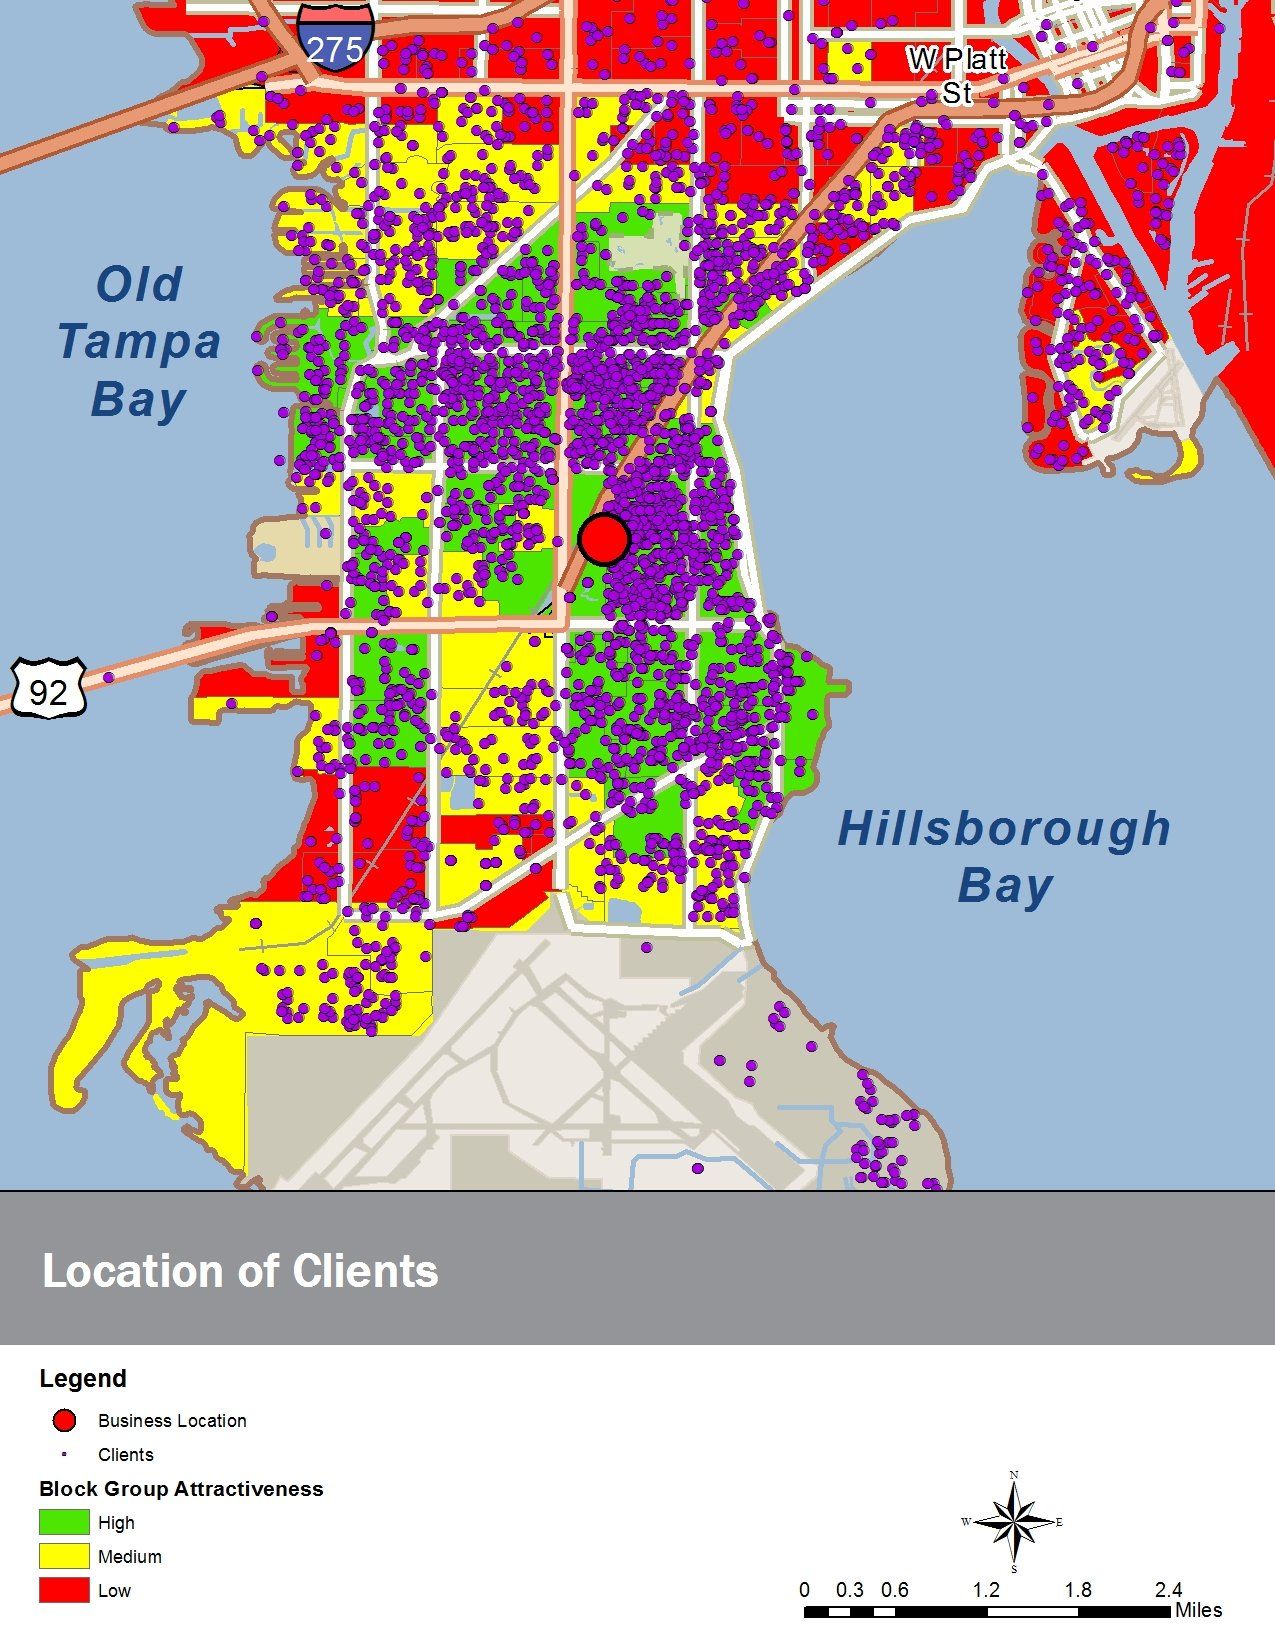
CLIENT MAPPING
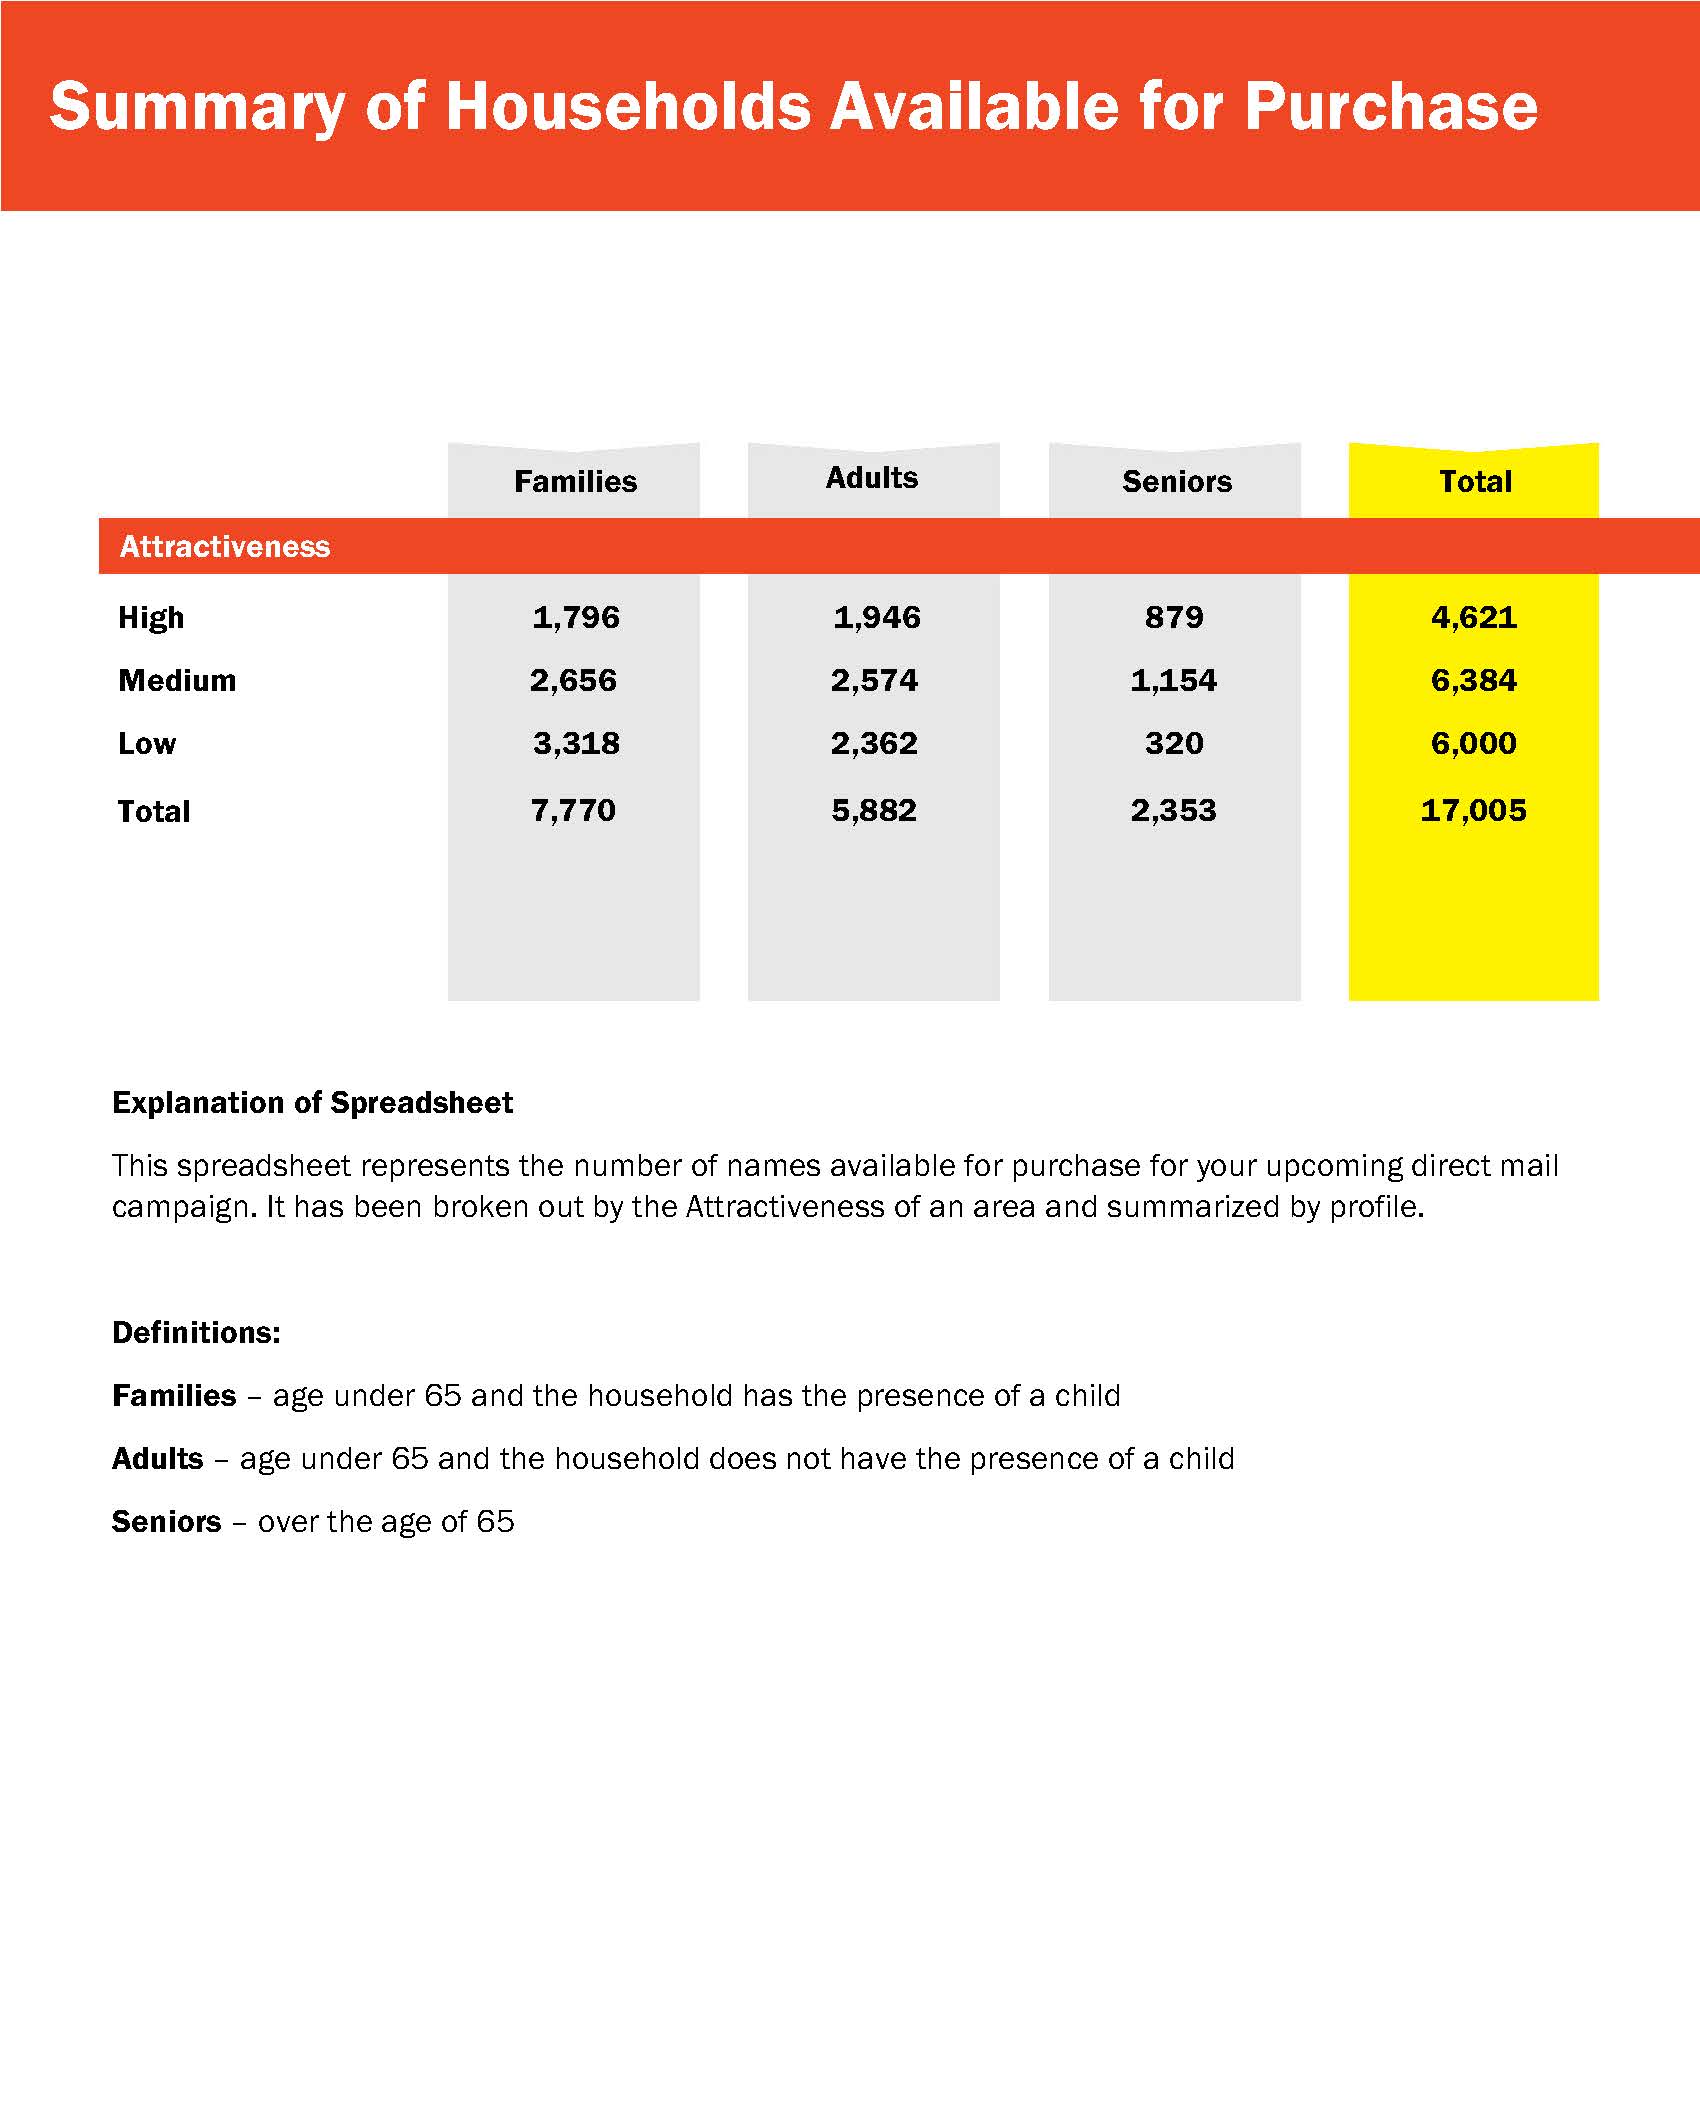
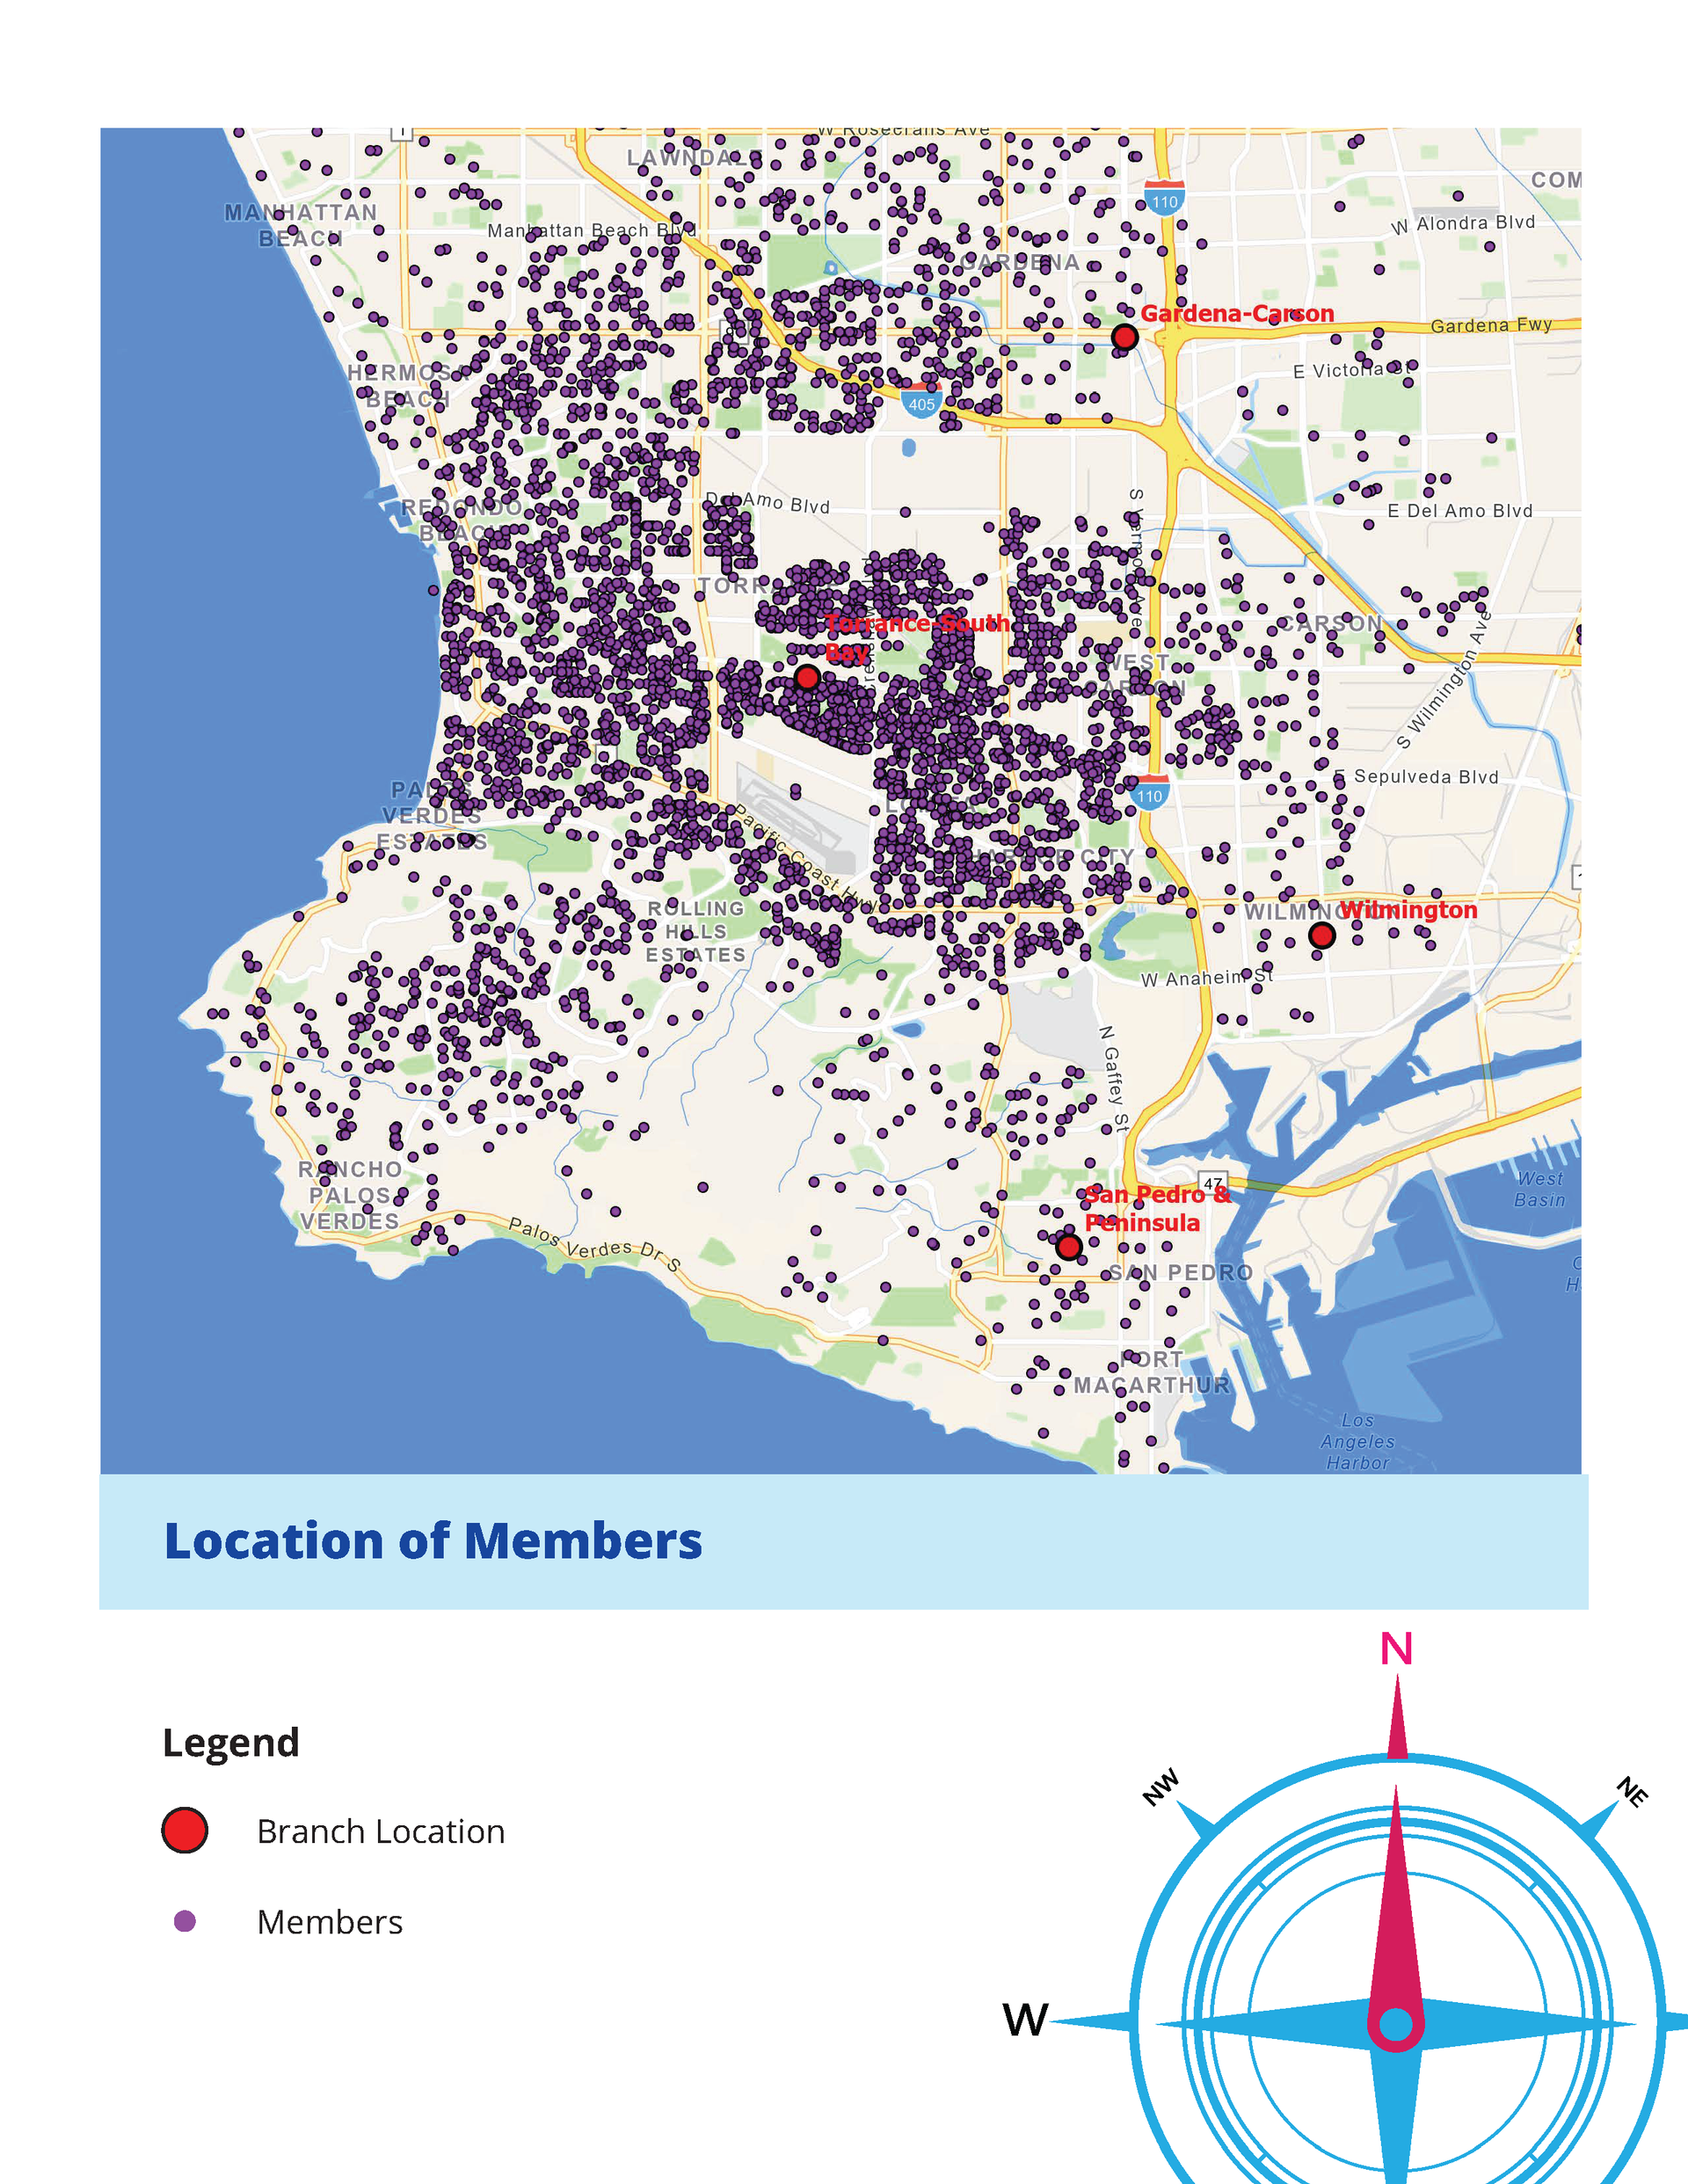
First we’ll plot your clients on a mpa, so that we can understand which neighborhoods your clients live in. Next we’ll assign neighborhood values using income, distance from the business, home value and other variables. Last, we’ll report a “High, Medium, or Low” segmentation value for the neighborhood - we call it "attractiveness".
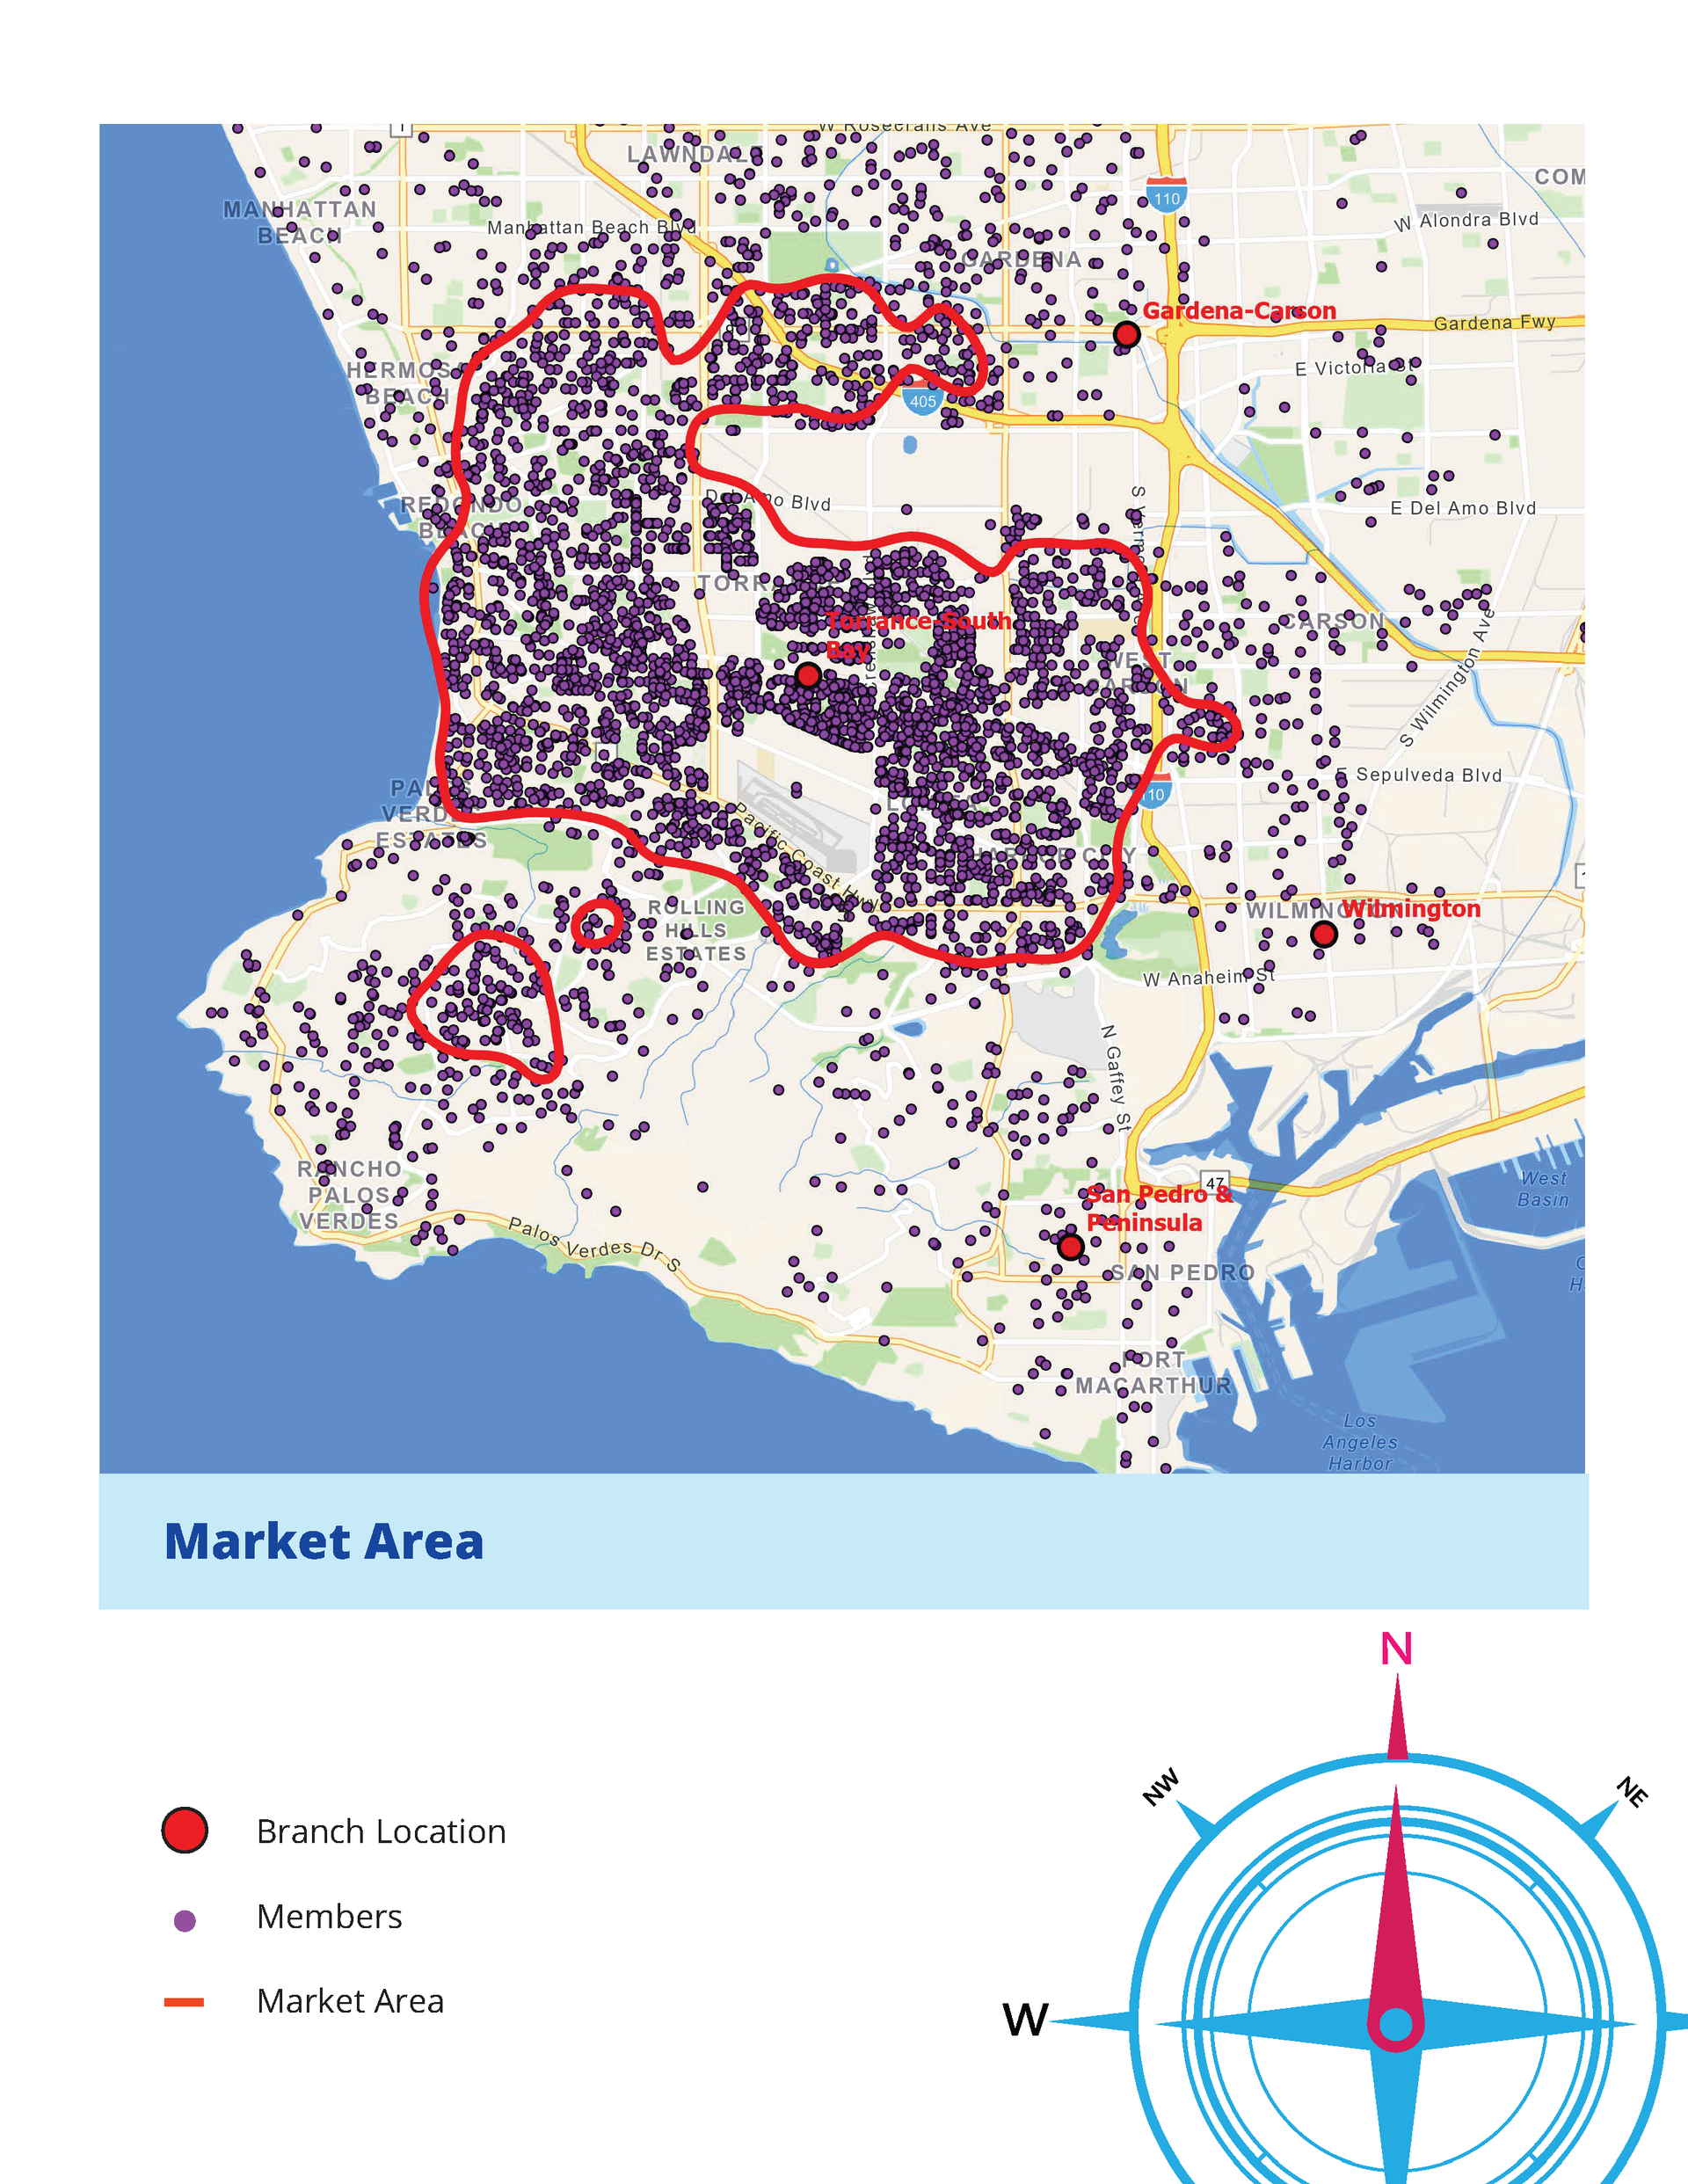
IDENTIFICATION OF LOW ATTRACTIVENESS
Look closely at the map. Giant holes develop in the yellow and red neighborhoods where there are less clients. Insightful Markets research shows that low attractiveness neighborhoods (red areas), are less likely to respond to your marketing efforts.
Drag the line across the market map to see how client density differs from penetration and identifying target groups.
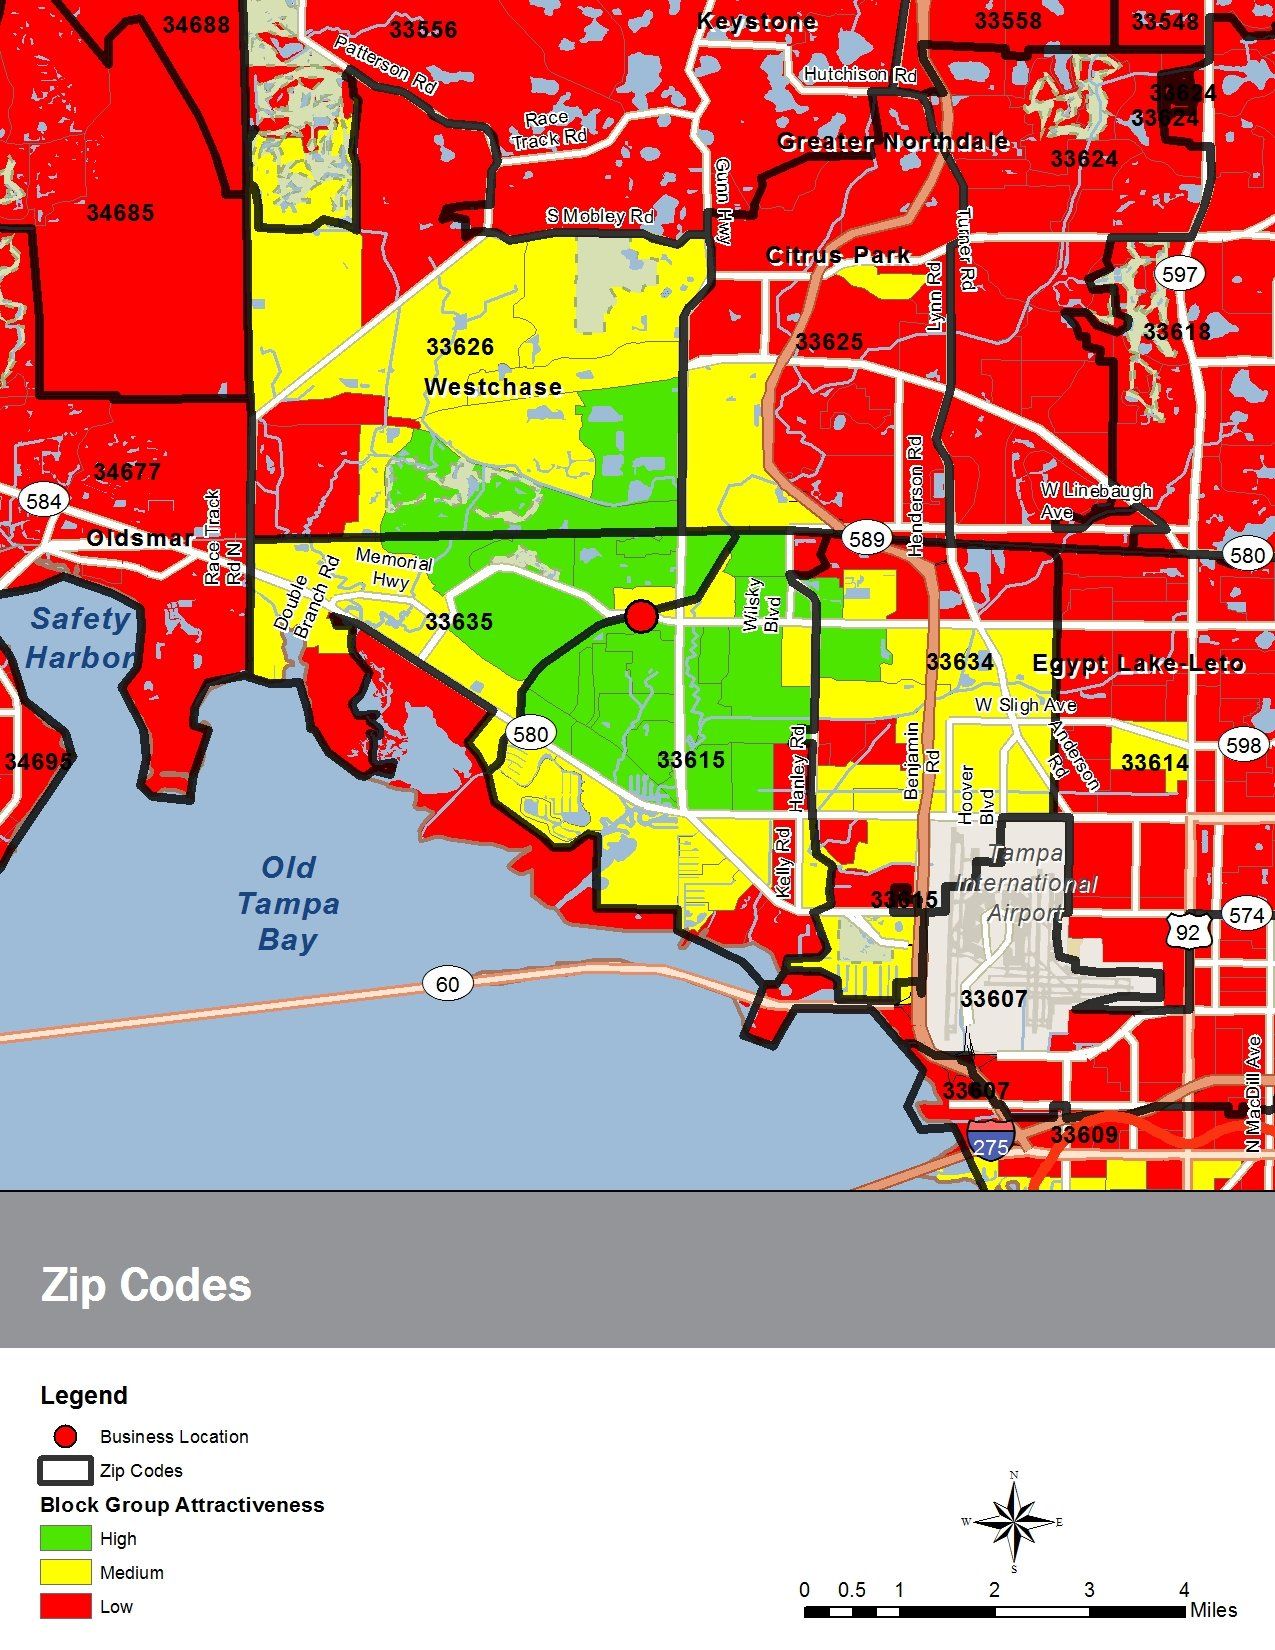
Drag the line across the market map to see the risk of wasting marketing dollars on large zip codes.
SEE WHY “ATTRACTIVENESS” RETURNS BETTER RESULTS THAN ZIP CODES
Zip codes are big, neighborhoods are smaller. At first glance, zip codes 33626, 33625 and 33615 would make perfect sense as zip codes to target. However, if you scroll to the left, you'll find that they are big and there will be a lot of wasted postcards. Using our methodology of attractiveness, we'll filter out the households that are less likely to respond to your marketing efforts.
Neighborhood attractiveness, provides you with a count report by area and demographic profile, so you’ll know exactly how many prospect members to target!