How to Use a Report
Use the power of information contained inside the pages of our customized market area reports. Each report can deliver in-depth insights of the market you already serve, which will dictate your next big move to improve your ROI.
LOCATION OF CLIENTS
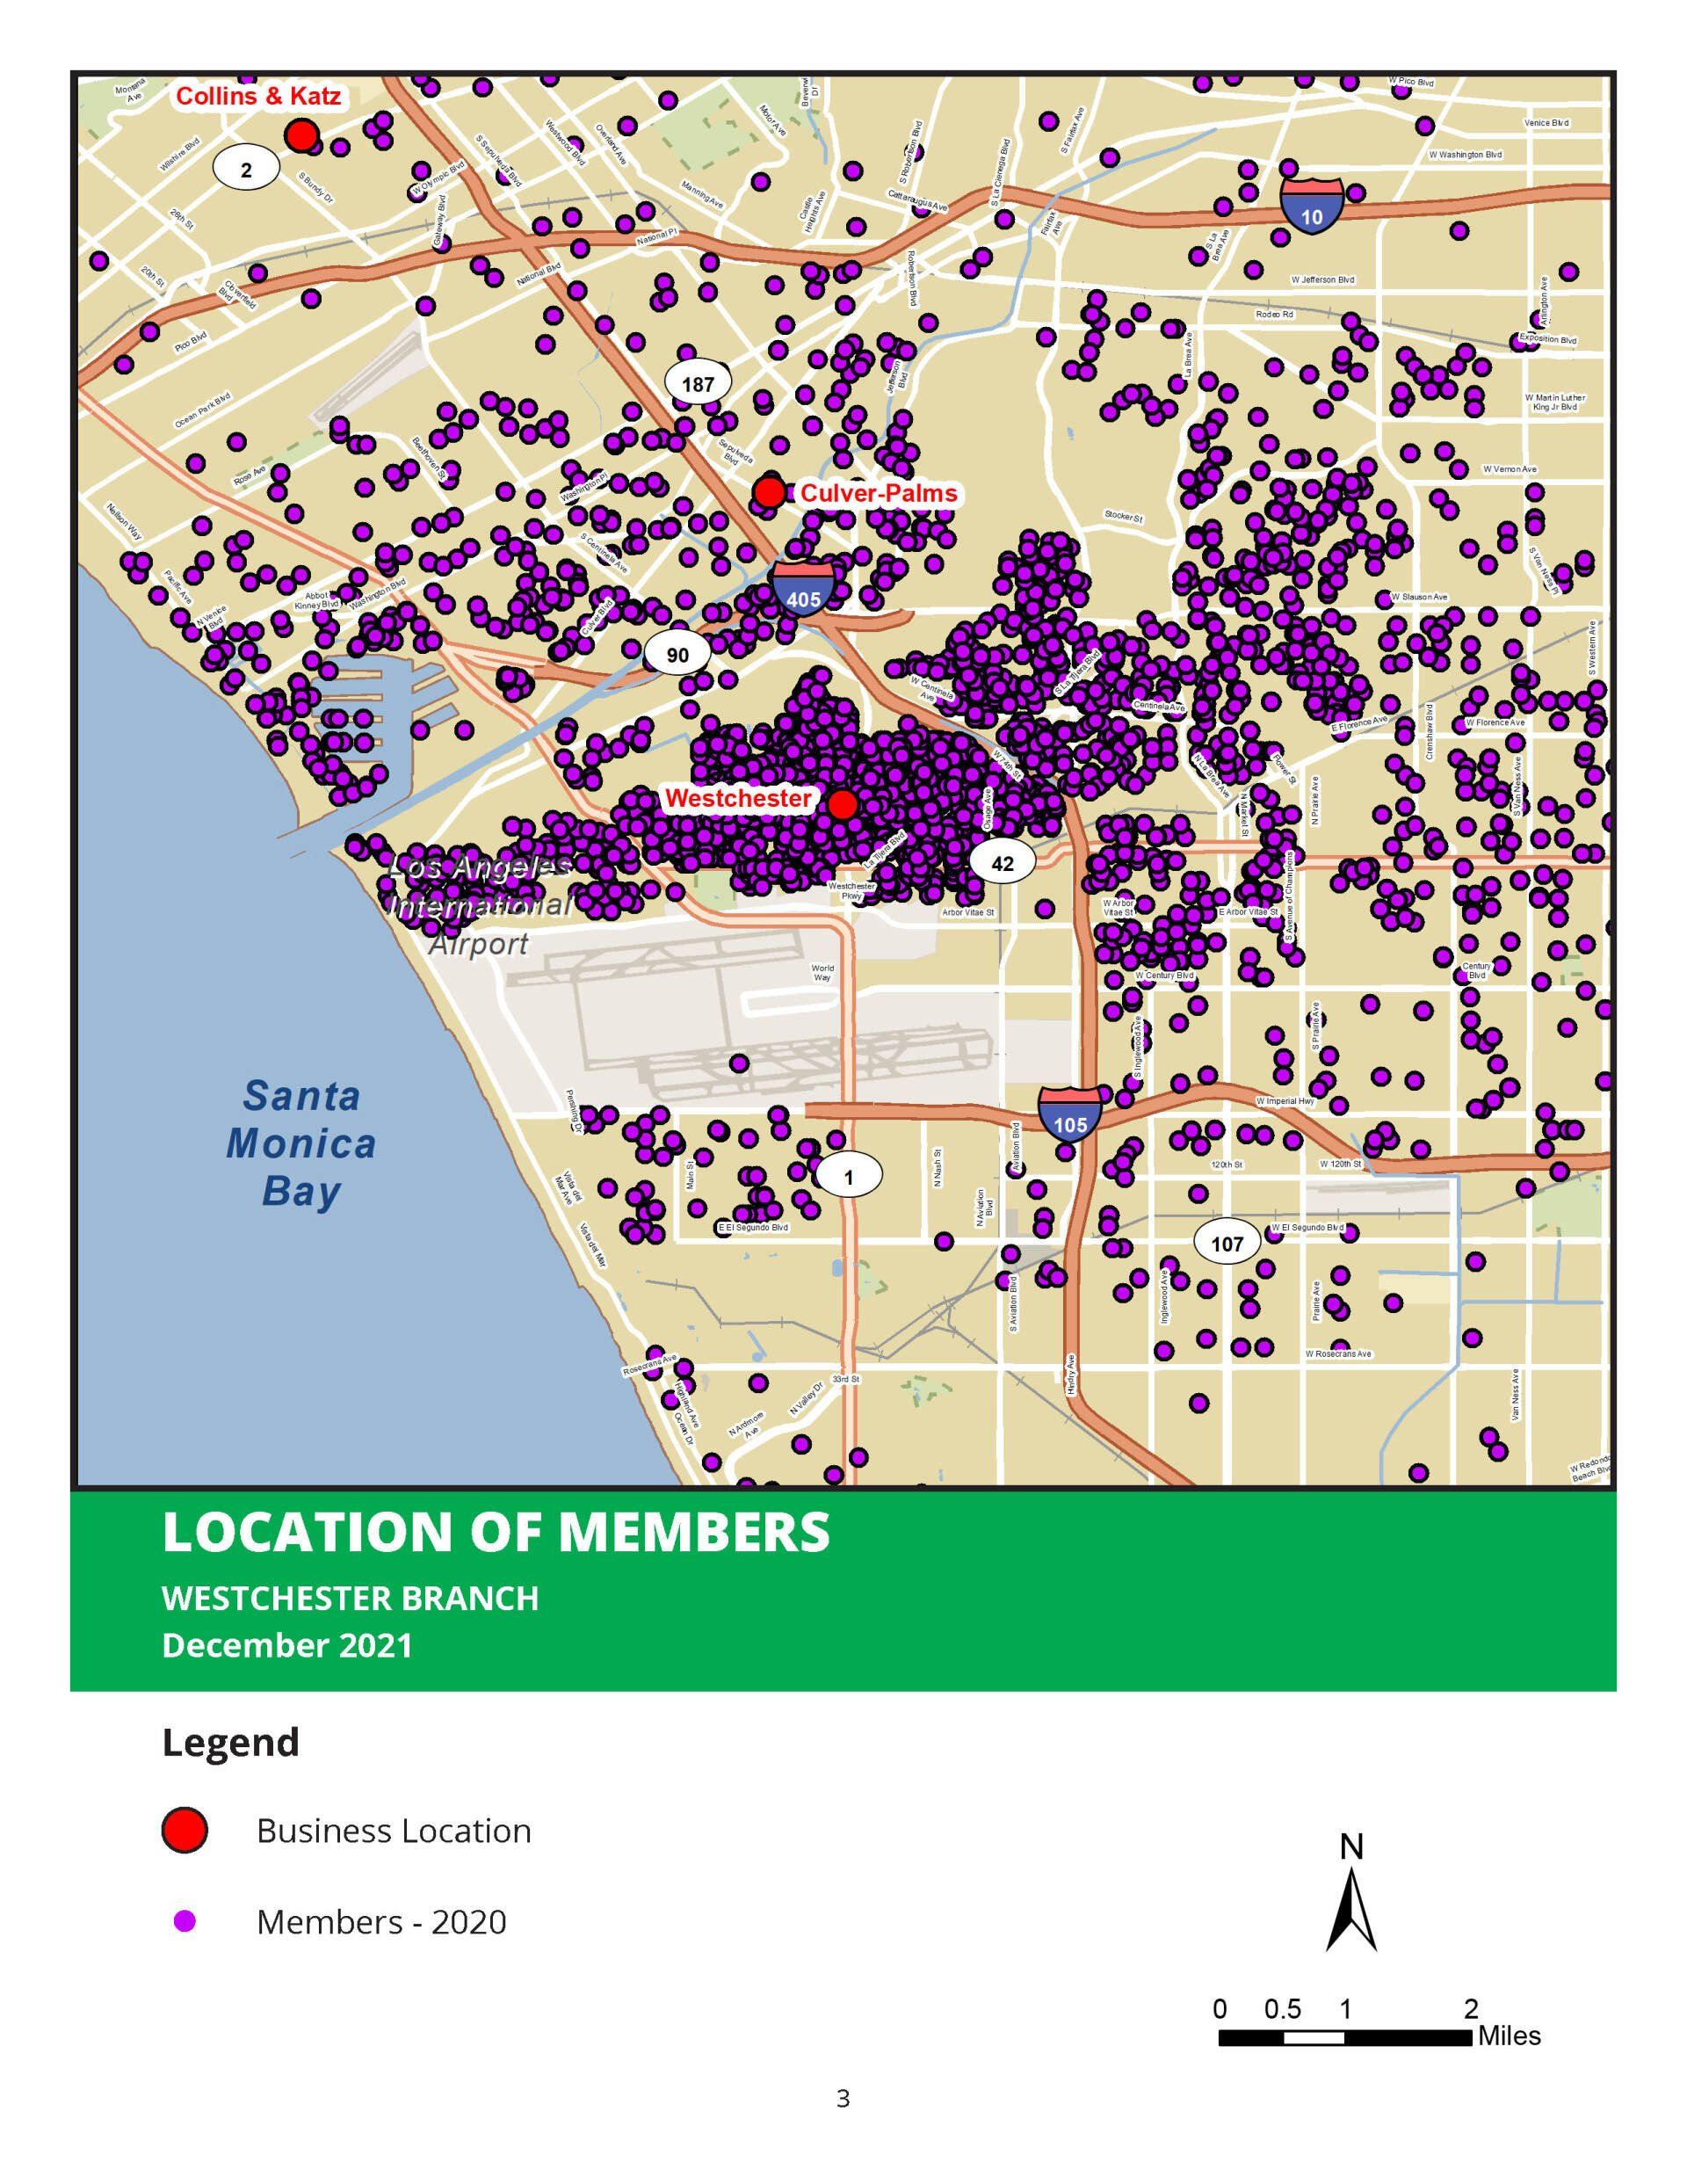
The first page of your Market Area Report is a map that shows the location of all of the client data that has been sent to Insightful Markets in the form of a dot on a map.
When an Insightful Markets client sends their house/client data, we will run the addresses through a process known as geo-coding, or appending the latitude and longitude to the record. This allows Insightful Markets to plot the clients on a map, so that we can begin analyzing the data using a number of spatial processes, including the creation the market area.
Insightful Markets believes that being able to see your data visually on a map, is one of the most powerful analytical techniques that a beginning marketer can perform.
Notice the location of the members on the map on the left. One of the first things we notice is that the members are distributed in a cigar shape, and that very few of them come from the north side of the river. Imagine how powerful that information can become if we were pulling a mailing list and we decided to use a radius selection. The marketer would find that all of the prospects that were pulled north of the location would be wasting valuable marketing dollars.
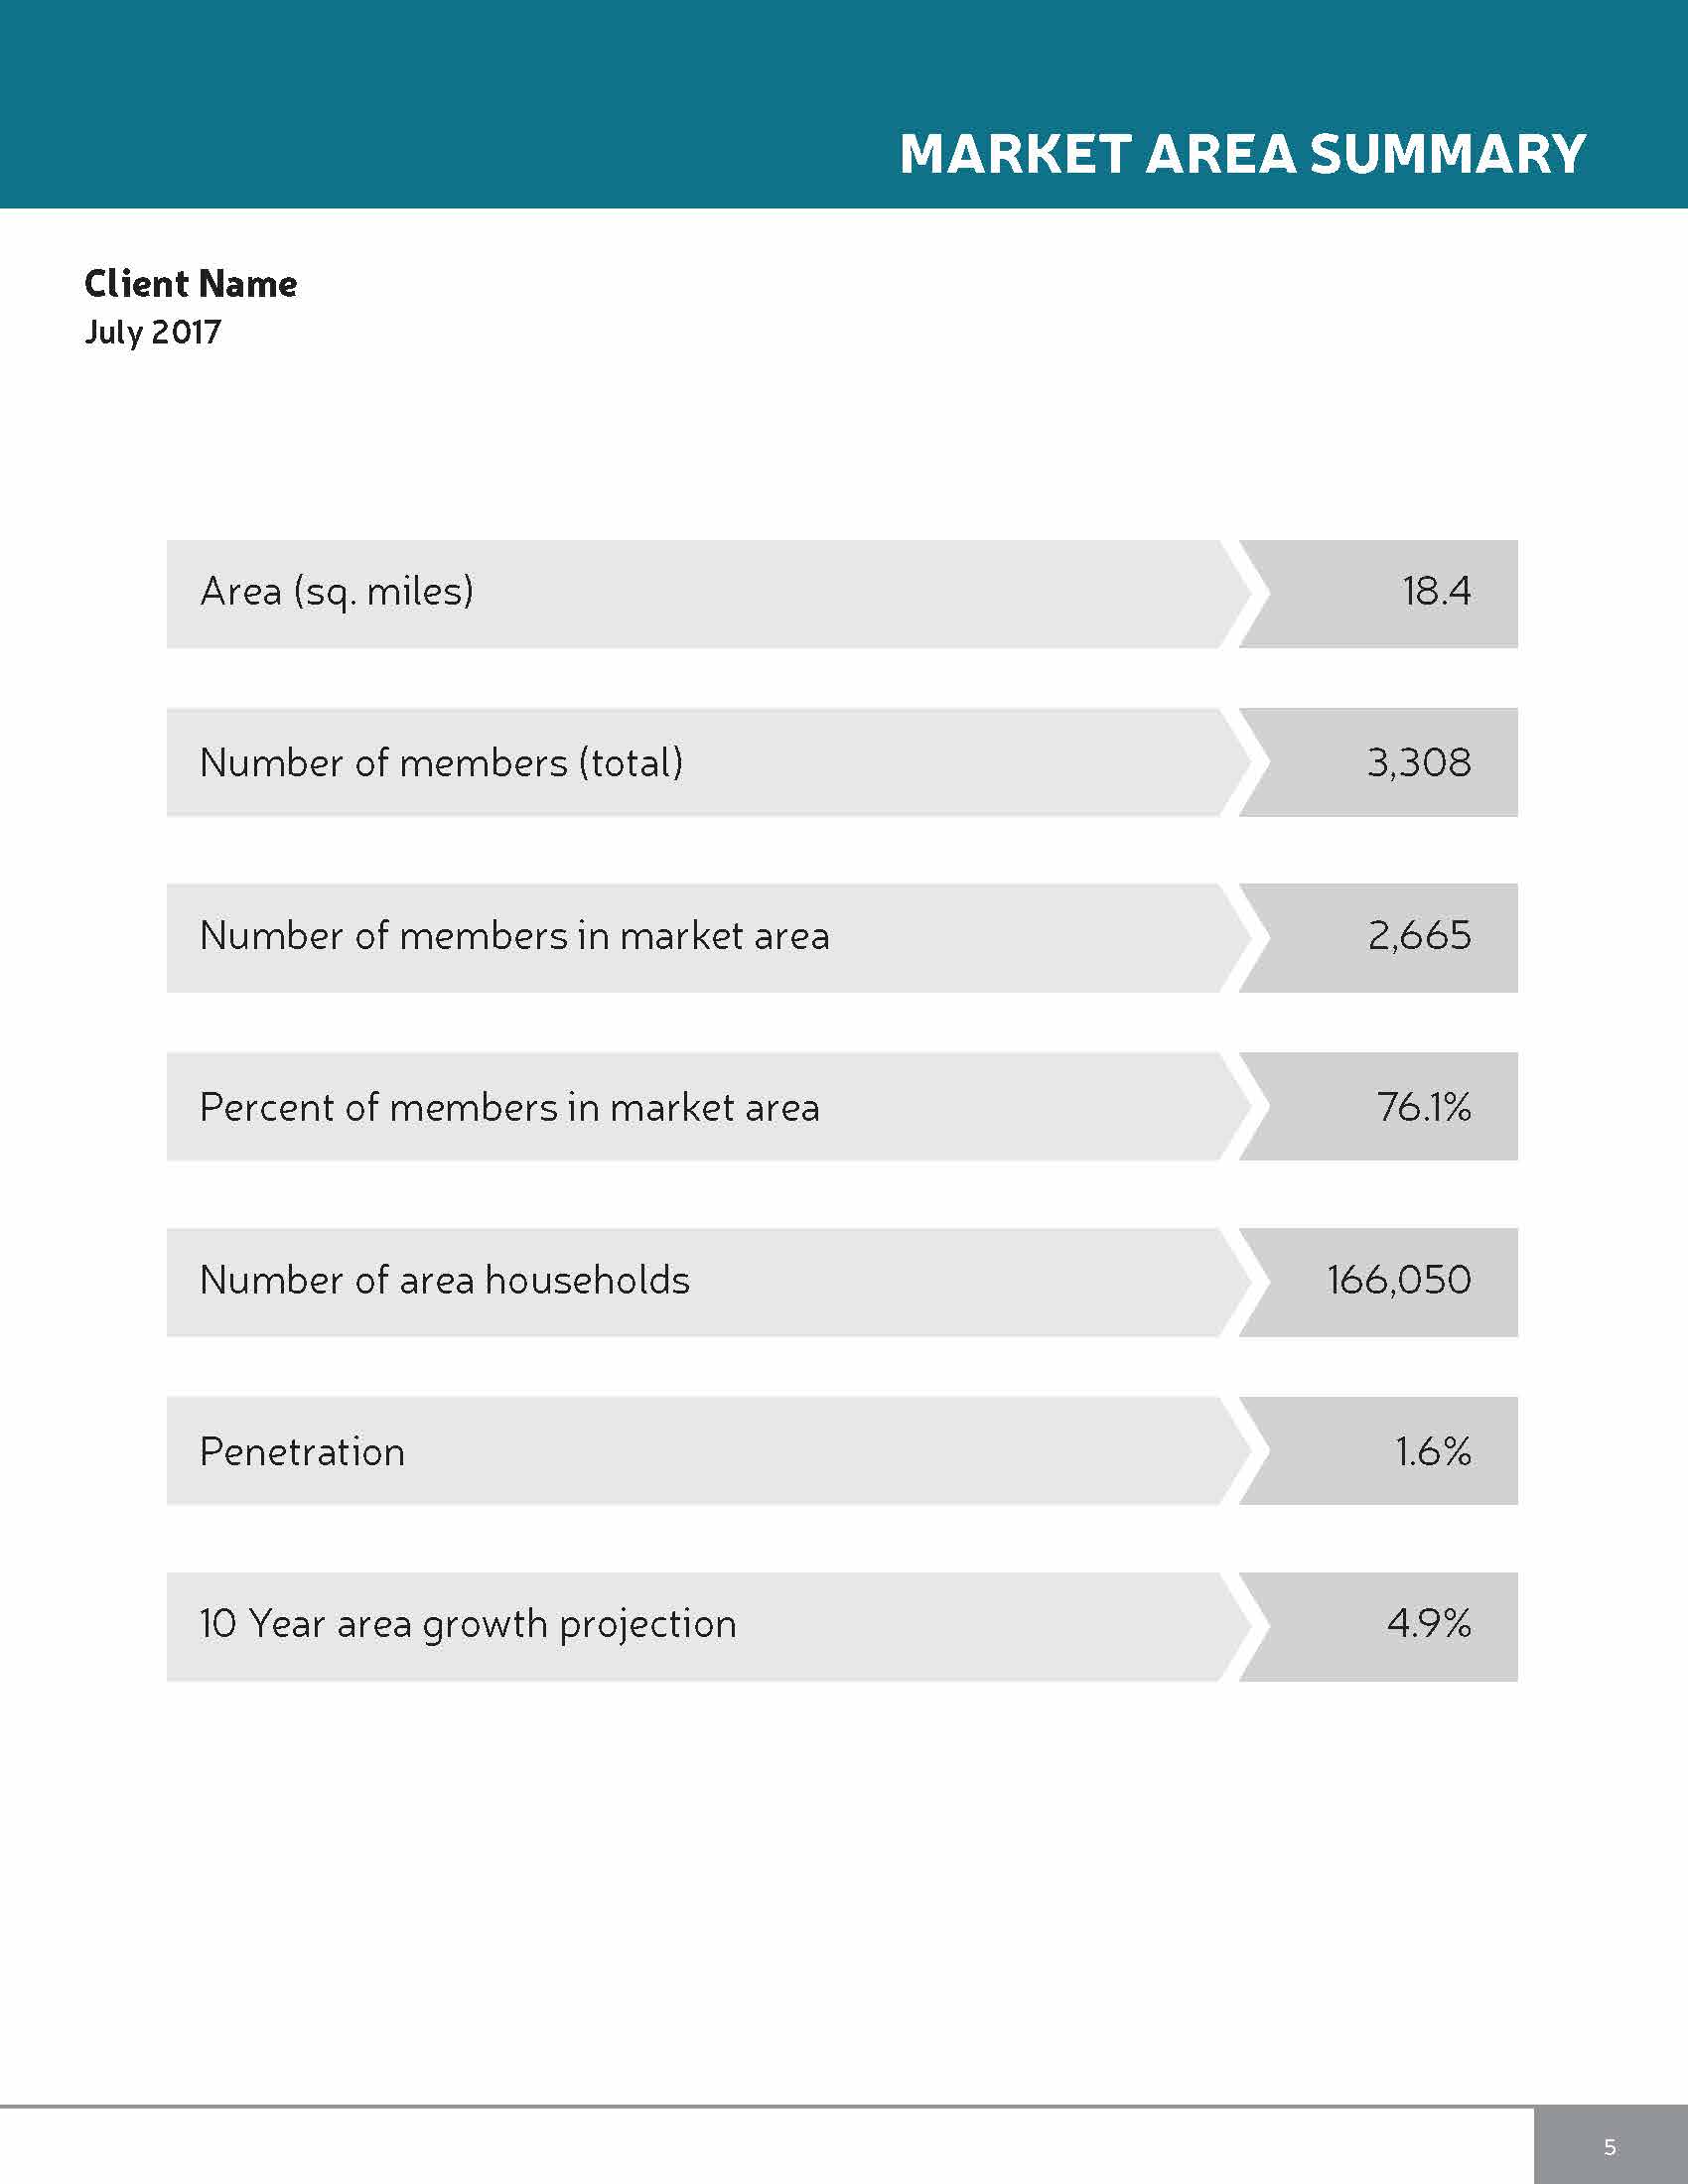
MARKET AREA SUMMARY
After we define the market area, we create a series of summaries, so that the client can understand some of the key metrics about the interior of the market area boundary. The below are the definitions of each variable displayed:
PROFILE SUMMARY OF THE REPORT
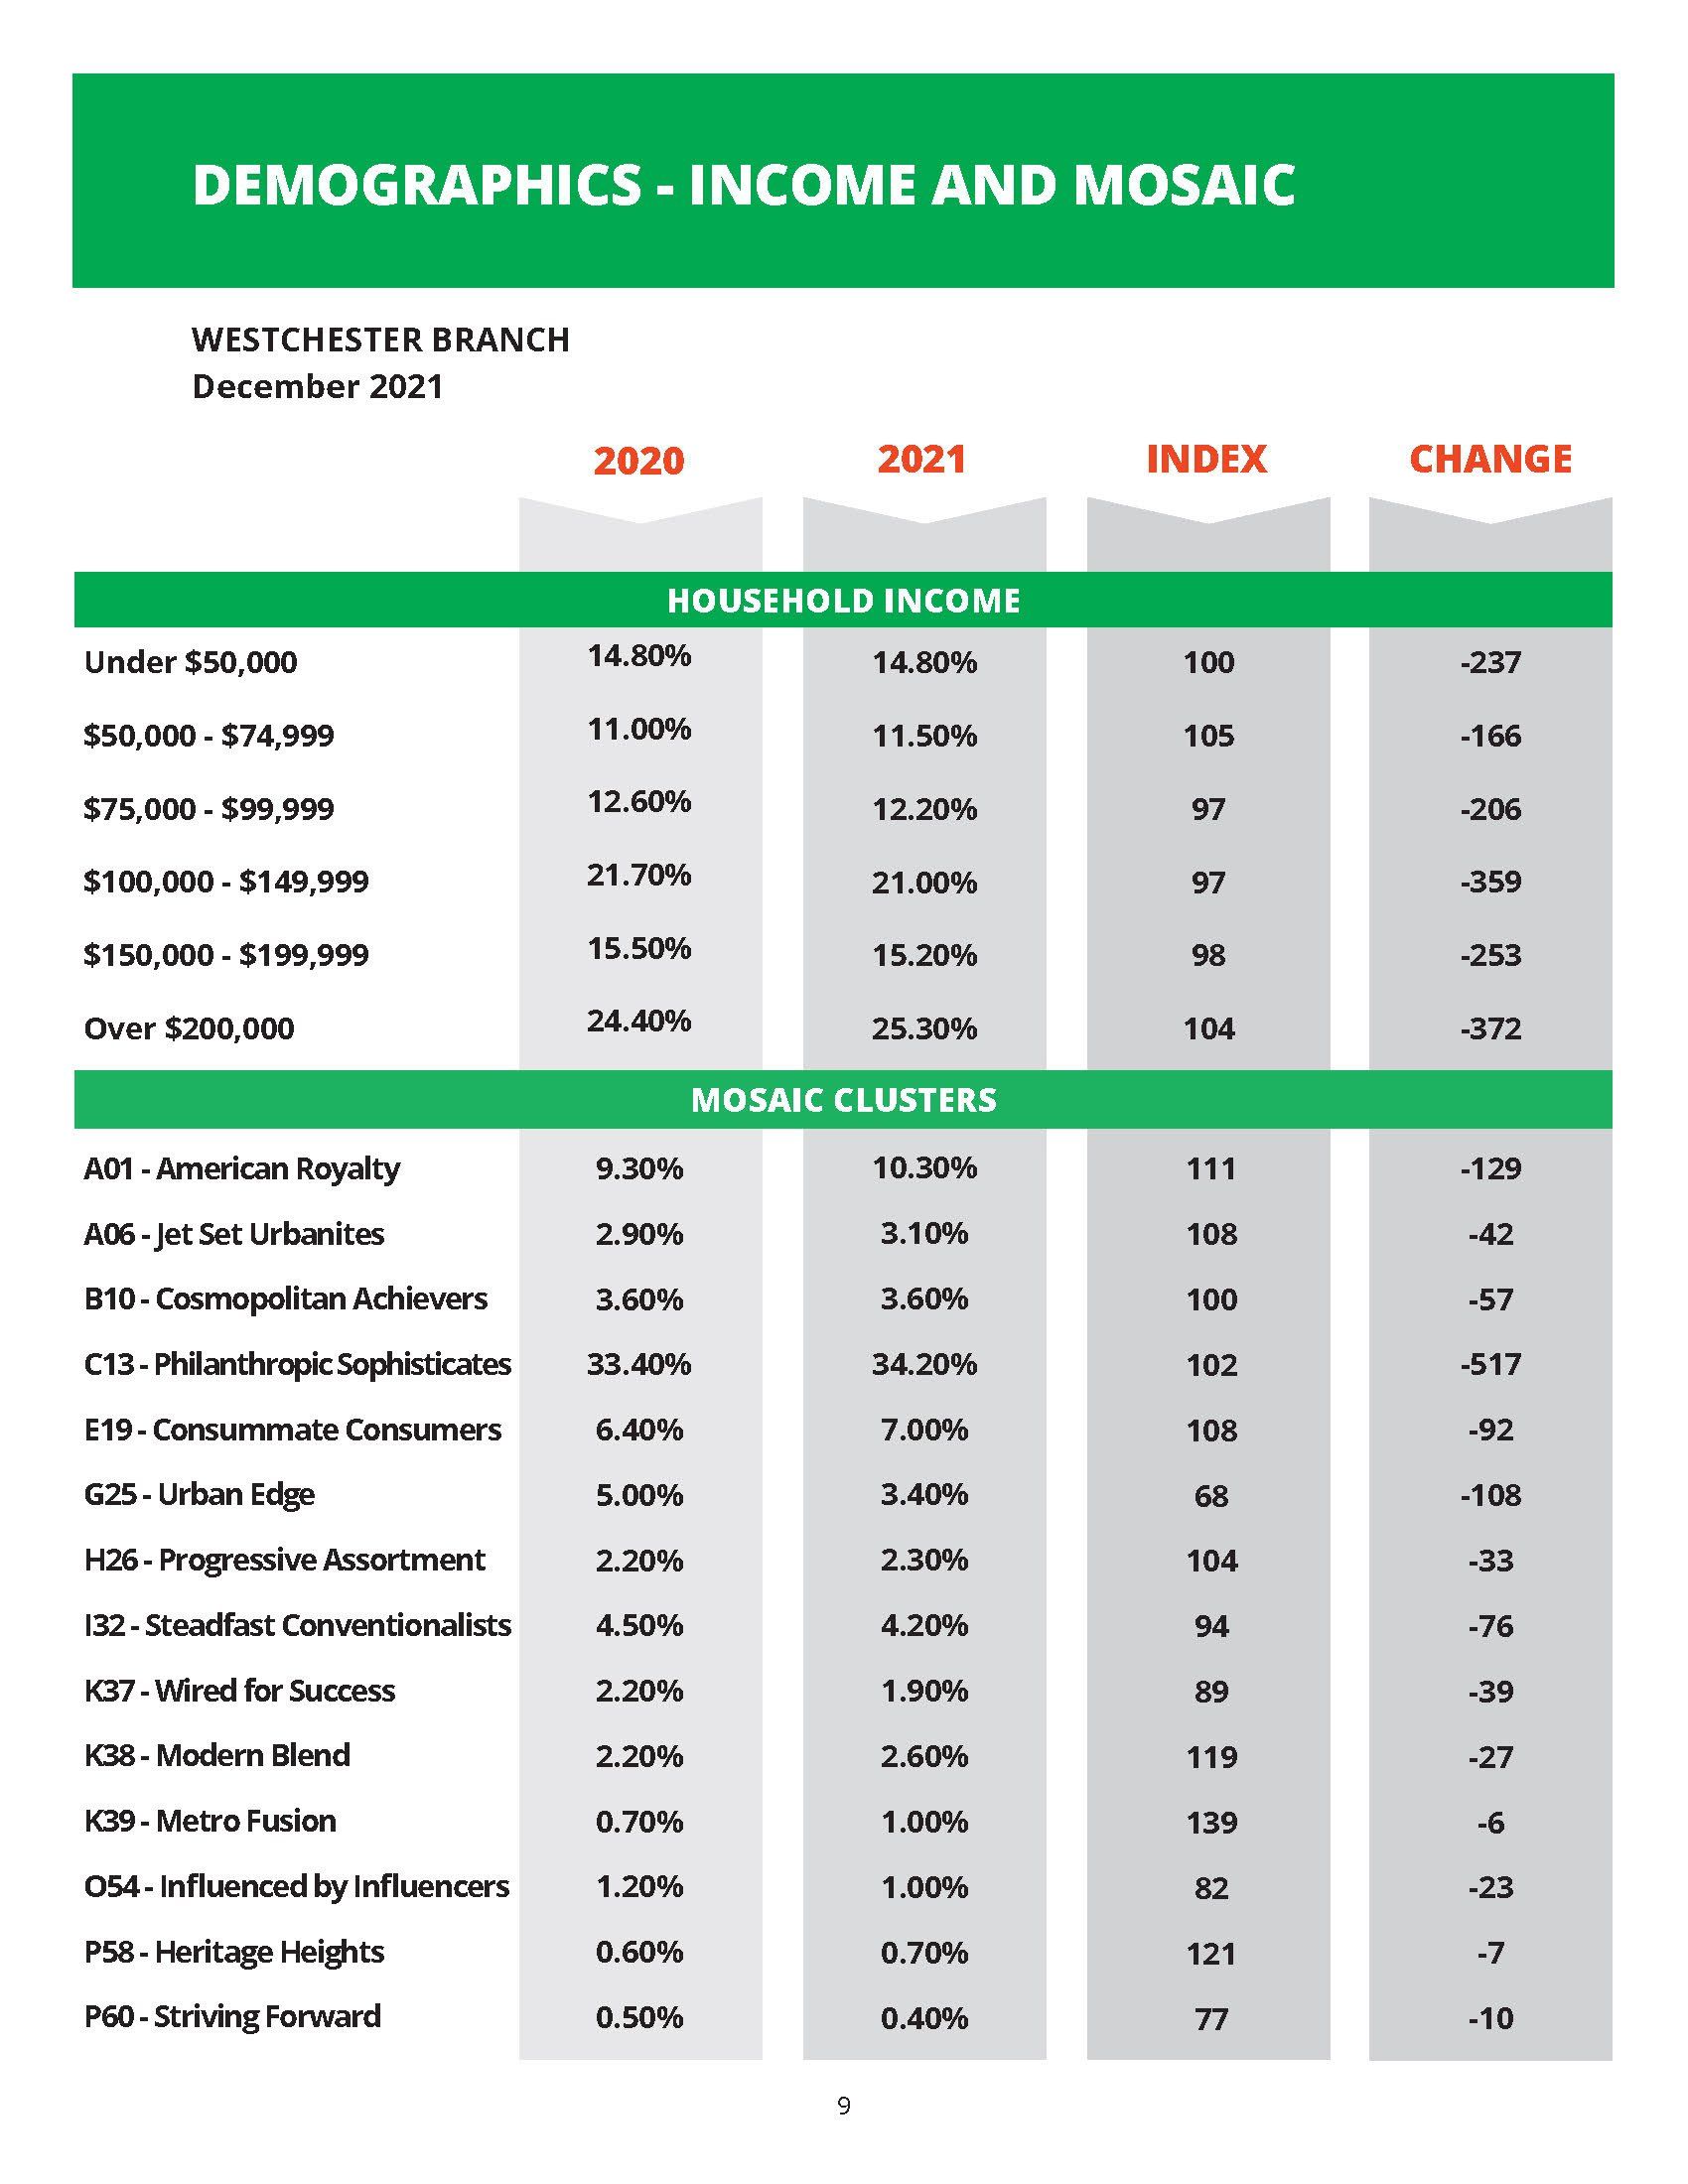
The market area characteristics page is the most important page in the report for understanding the demographic profile of your clients and how that profile compares to the overall market area.
Part of the market area reporting process involves doing what Insightful Markets calls a “data enhancement”. A data enhancement is when MAR uploads your client data to Experian using a secure FTP. Experian then appends known and modeled demographic variables to the client record, so that Insightful Markets can summarize and compare your clients to the overall market area. This process helps us understand where your business may be over/under performing when compared to the market your business serves.
The performance of your business as it relates to the market is reported as the metric known as the Index. The Index is the direct relationship between the area and the clients. An Index score of 100 indicates that the client demographic variable being analyzed, exactly mirrors the area. An Index over 100 means that there are more clients that frequent your location with that demographic characteristic than the area – also known as over-penetrating. Where as, a score under 100 means that your business is under-penetrating for that particular demographic variable. As a note, the area and member columns for a particular demographic always sum to within 1 percentage point of 100%.
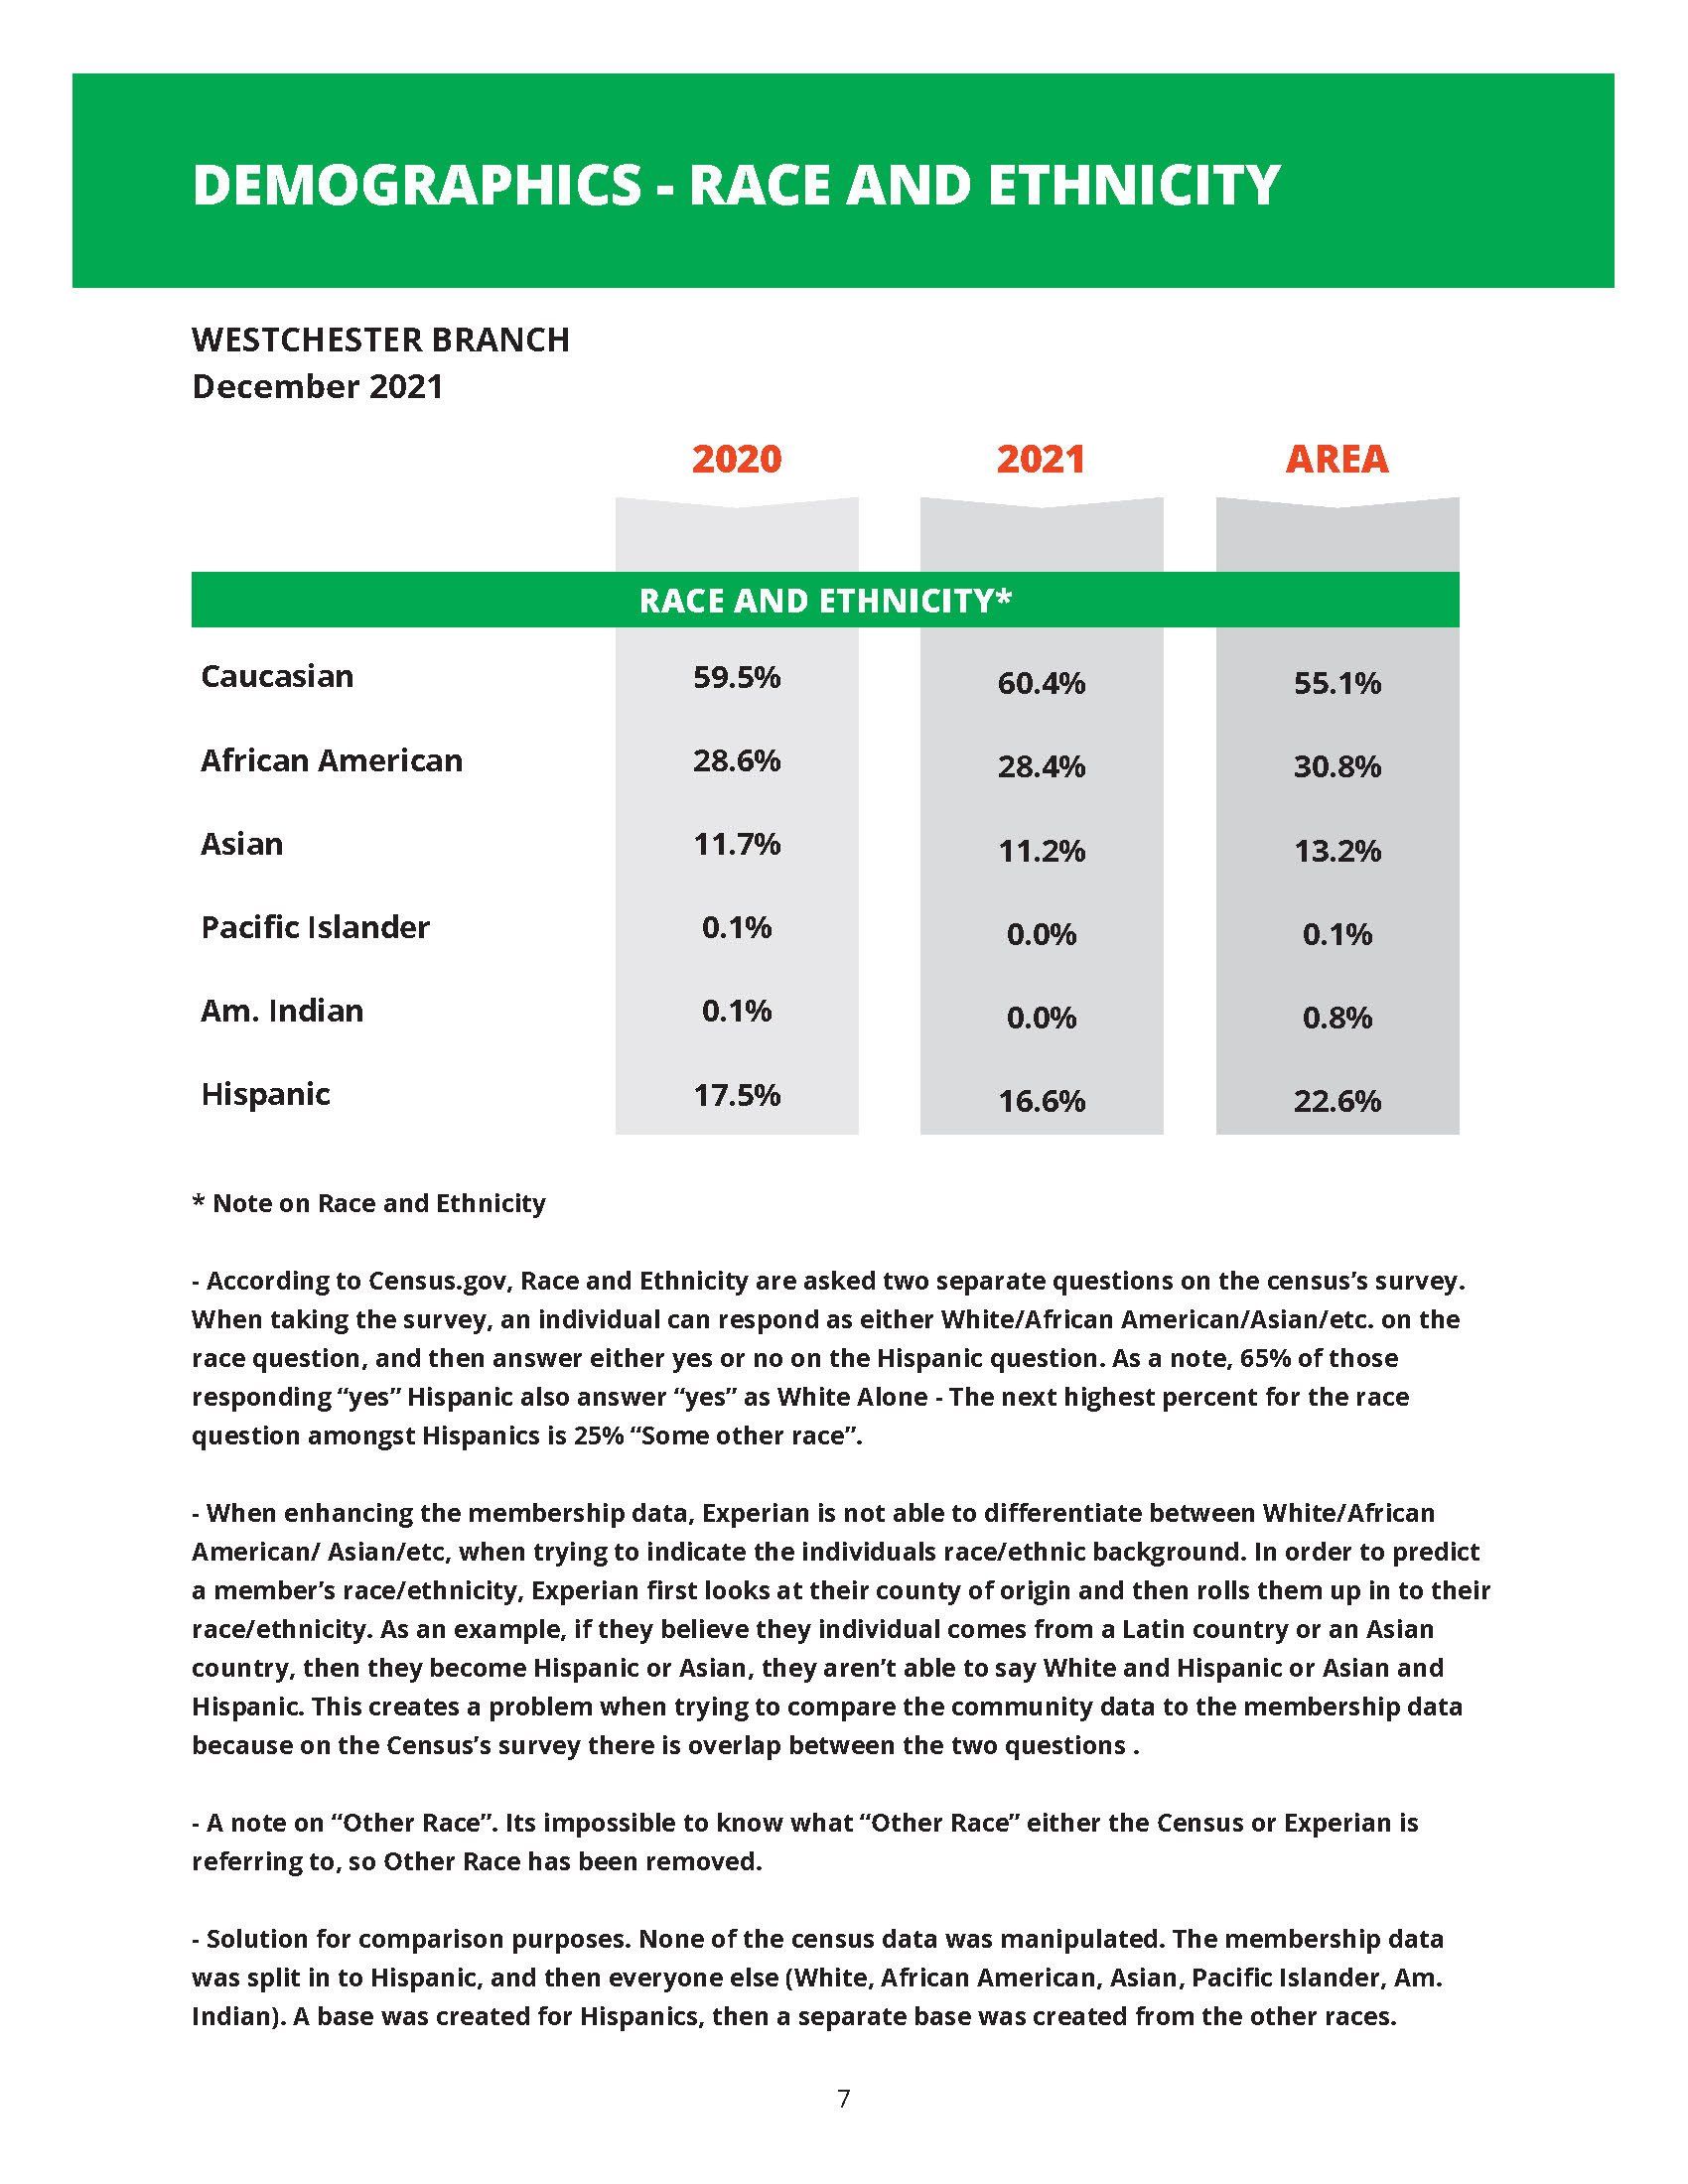
MARKET AREA ETHNICITY
Insightful Markets has the ability to report ethnicity if your organization sees value in knowing the racial breakdown of its clients compared to the market area.
THEMATIC MAPS - MEDIAN INCOME
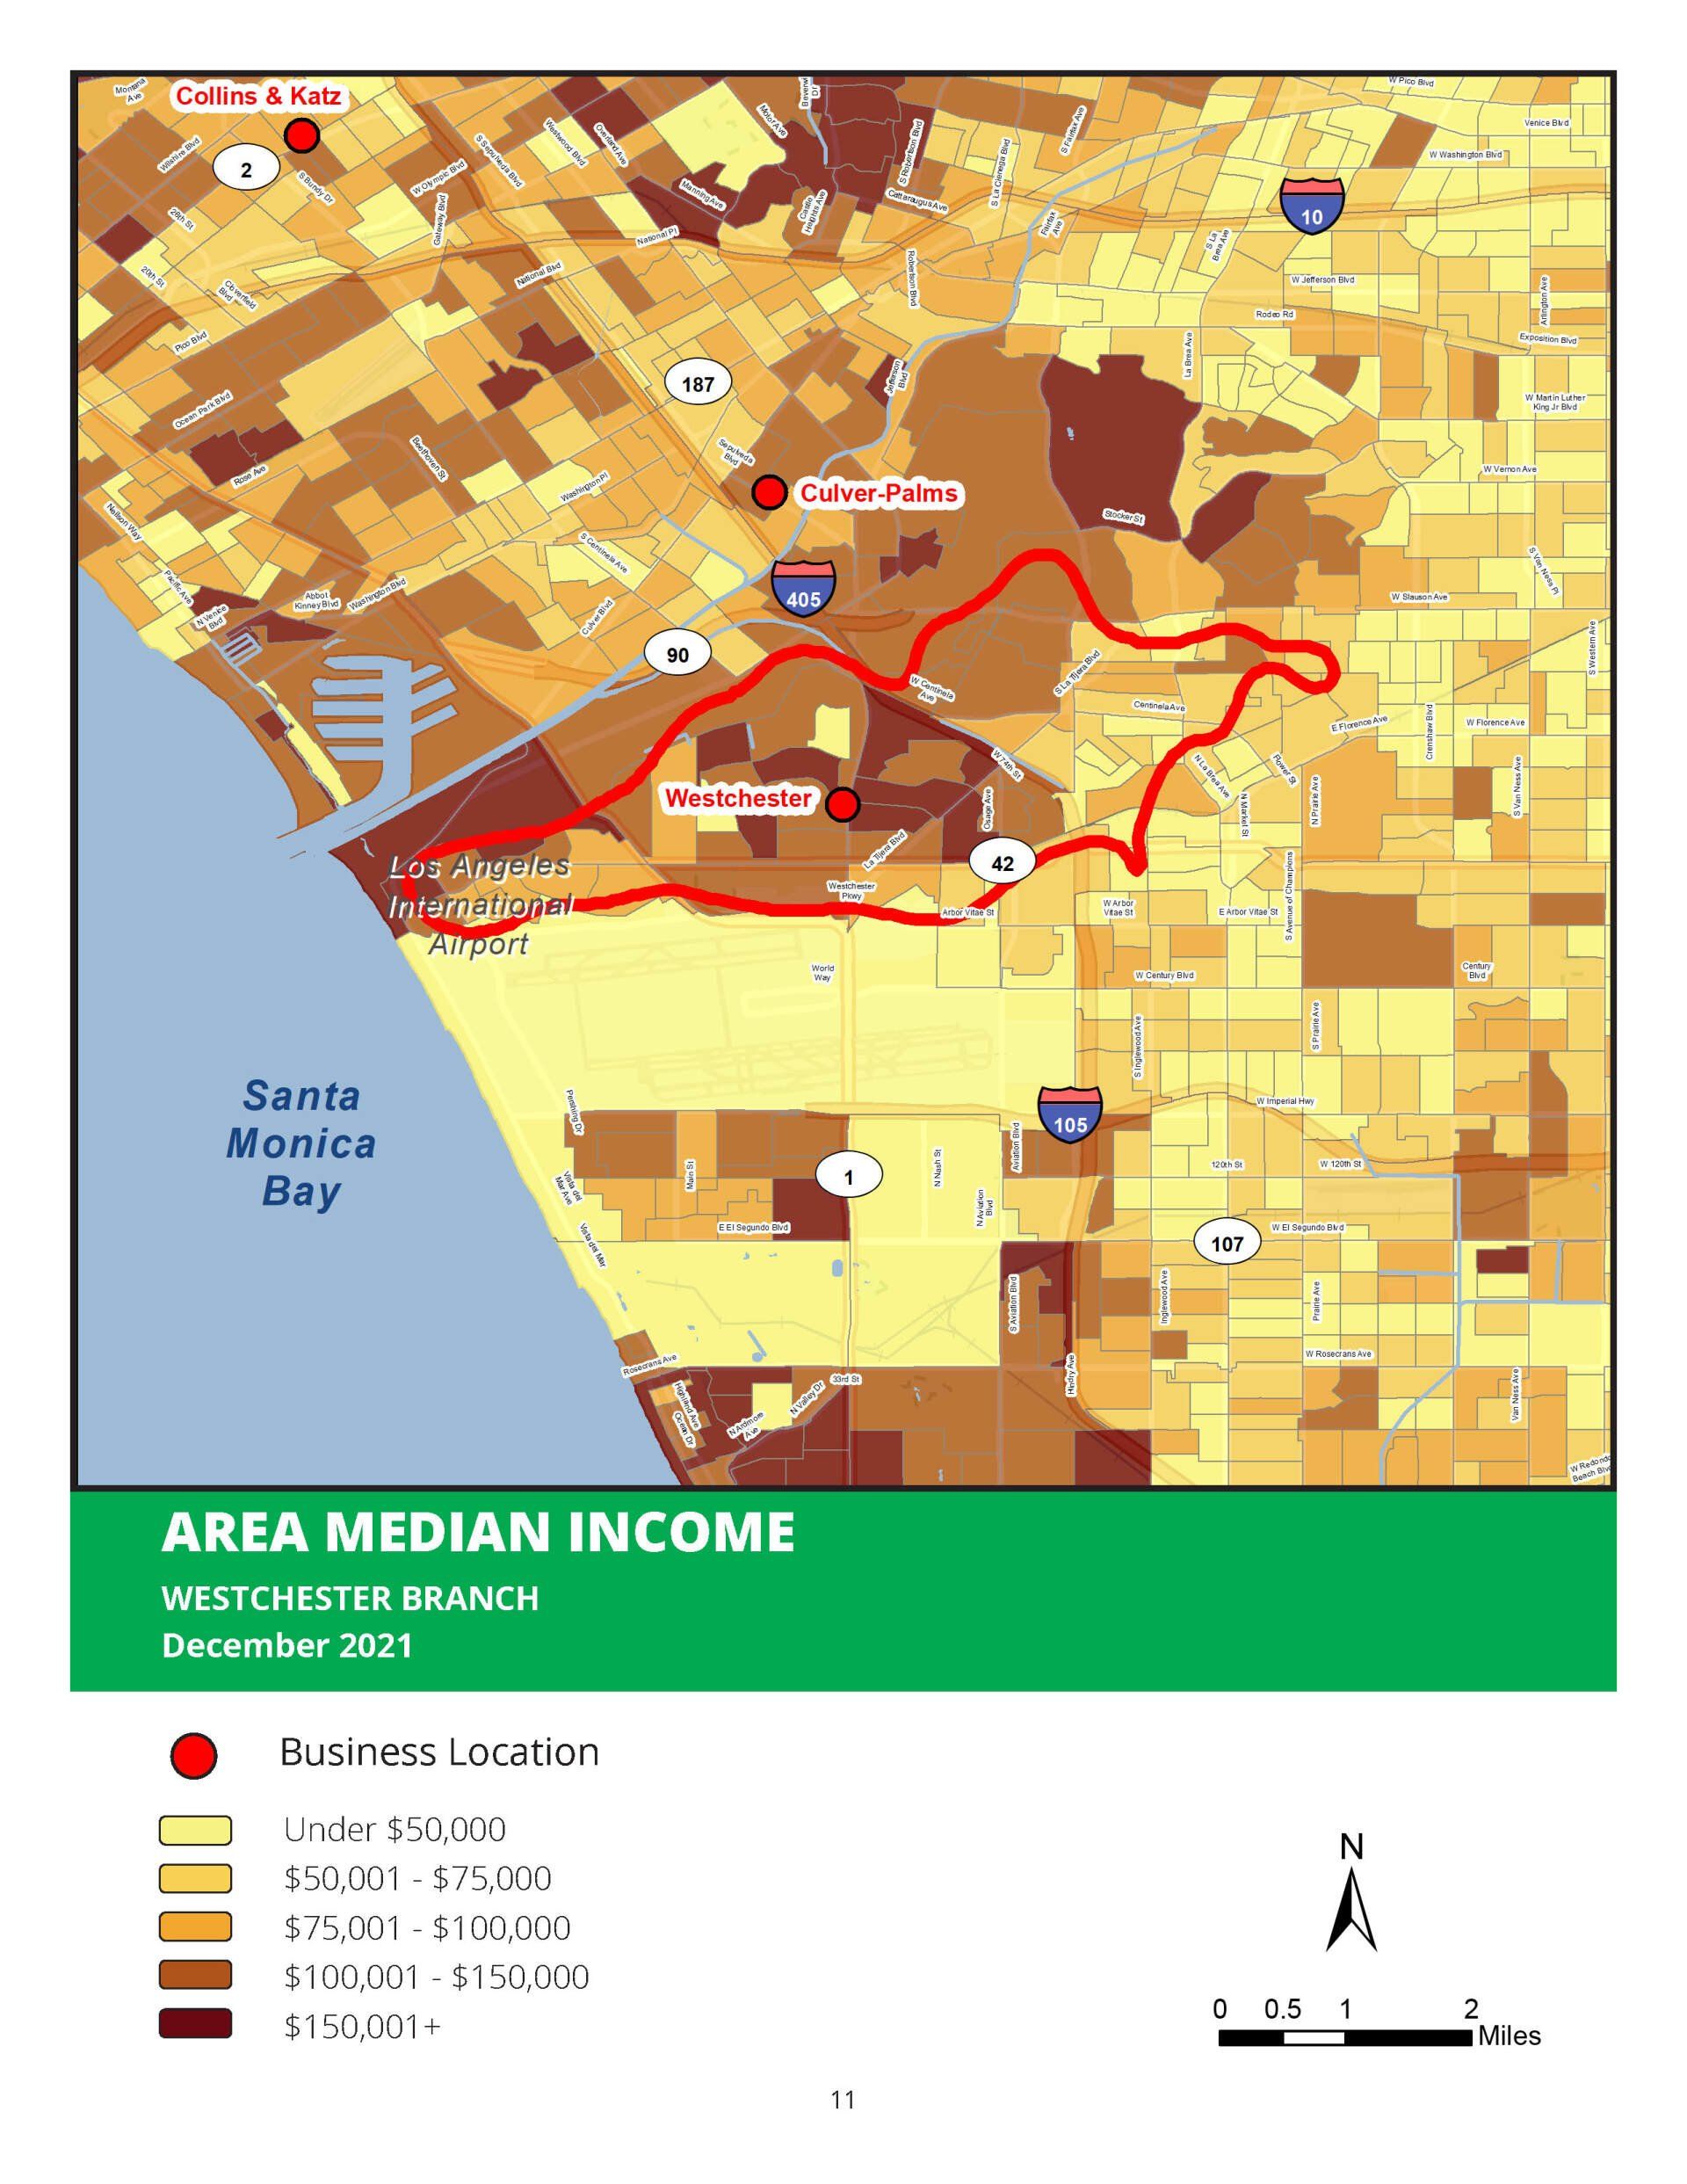
Your Market Area Report will contain a number of thematic maps. Thematic maps are usually a single *geo-demographic variable reported, so that you can quickly and easily see pockets of opportunity for that particular geo-demographic variable.
For Median Income, you can see that this market area tends to skew towards the lower income areas. Notice how the market area bends around the neighborhoods with higher income.
Market Area Reports can reports dozens of geo-demographic variables, but common ones include:
- Median Income
- Ethnicity
- High/Low Income
- Household Composition
- Generation
- Home Value
- Owner Occupancy
*Geo-demographic is defined as the aggregation of a particular variable by the US Census for neighborhoods on the map.
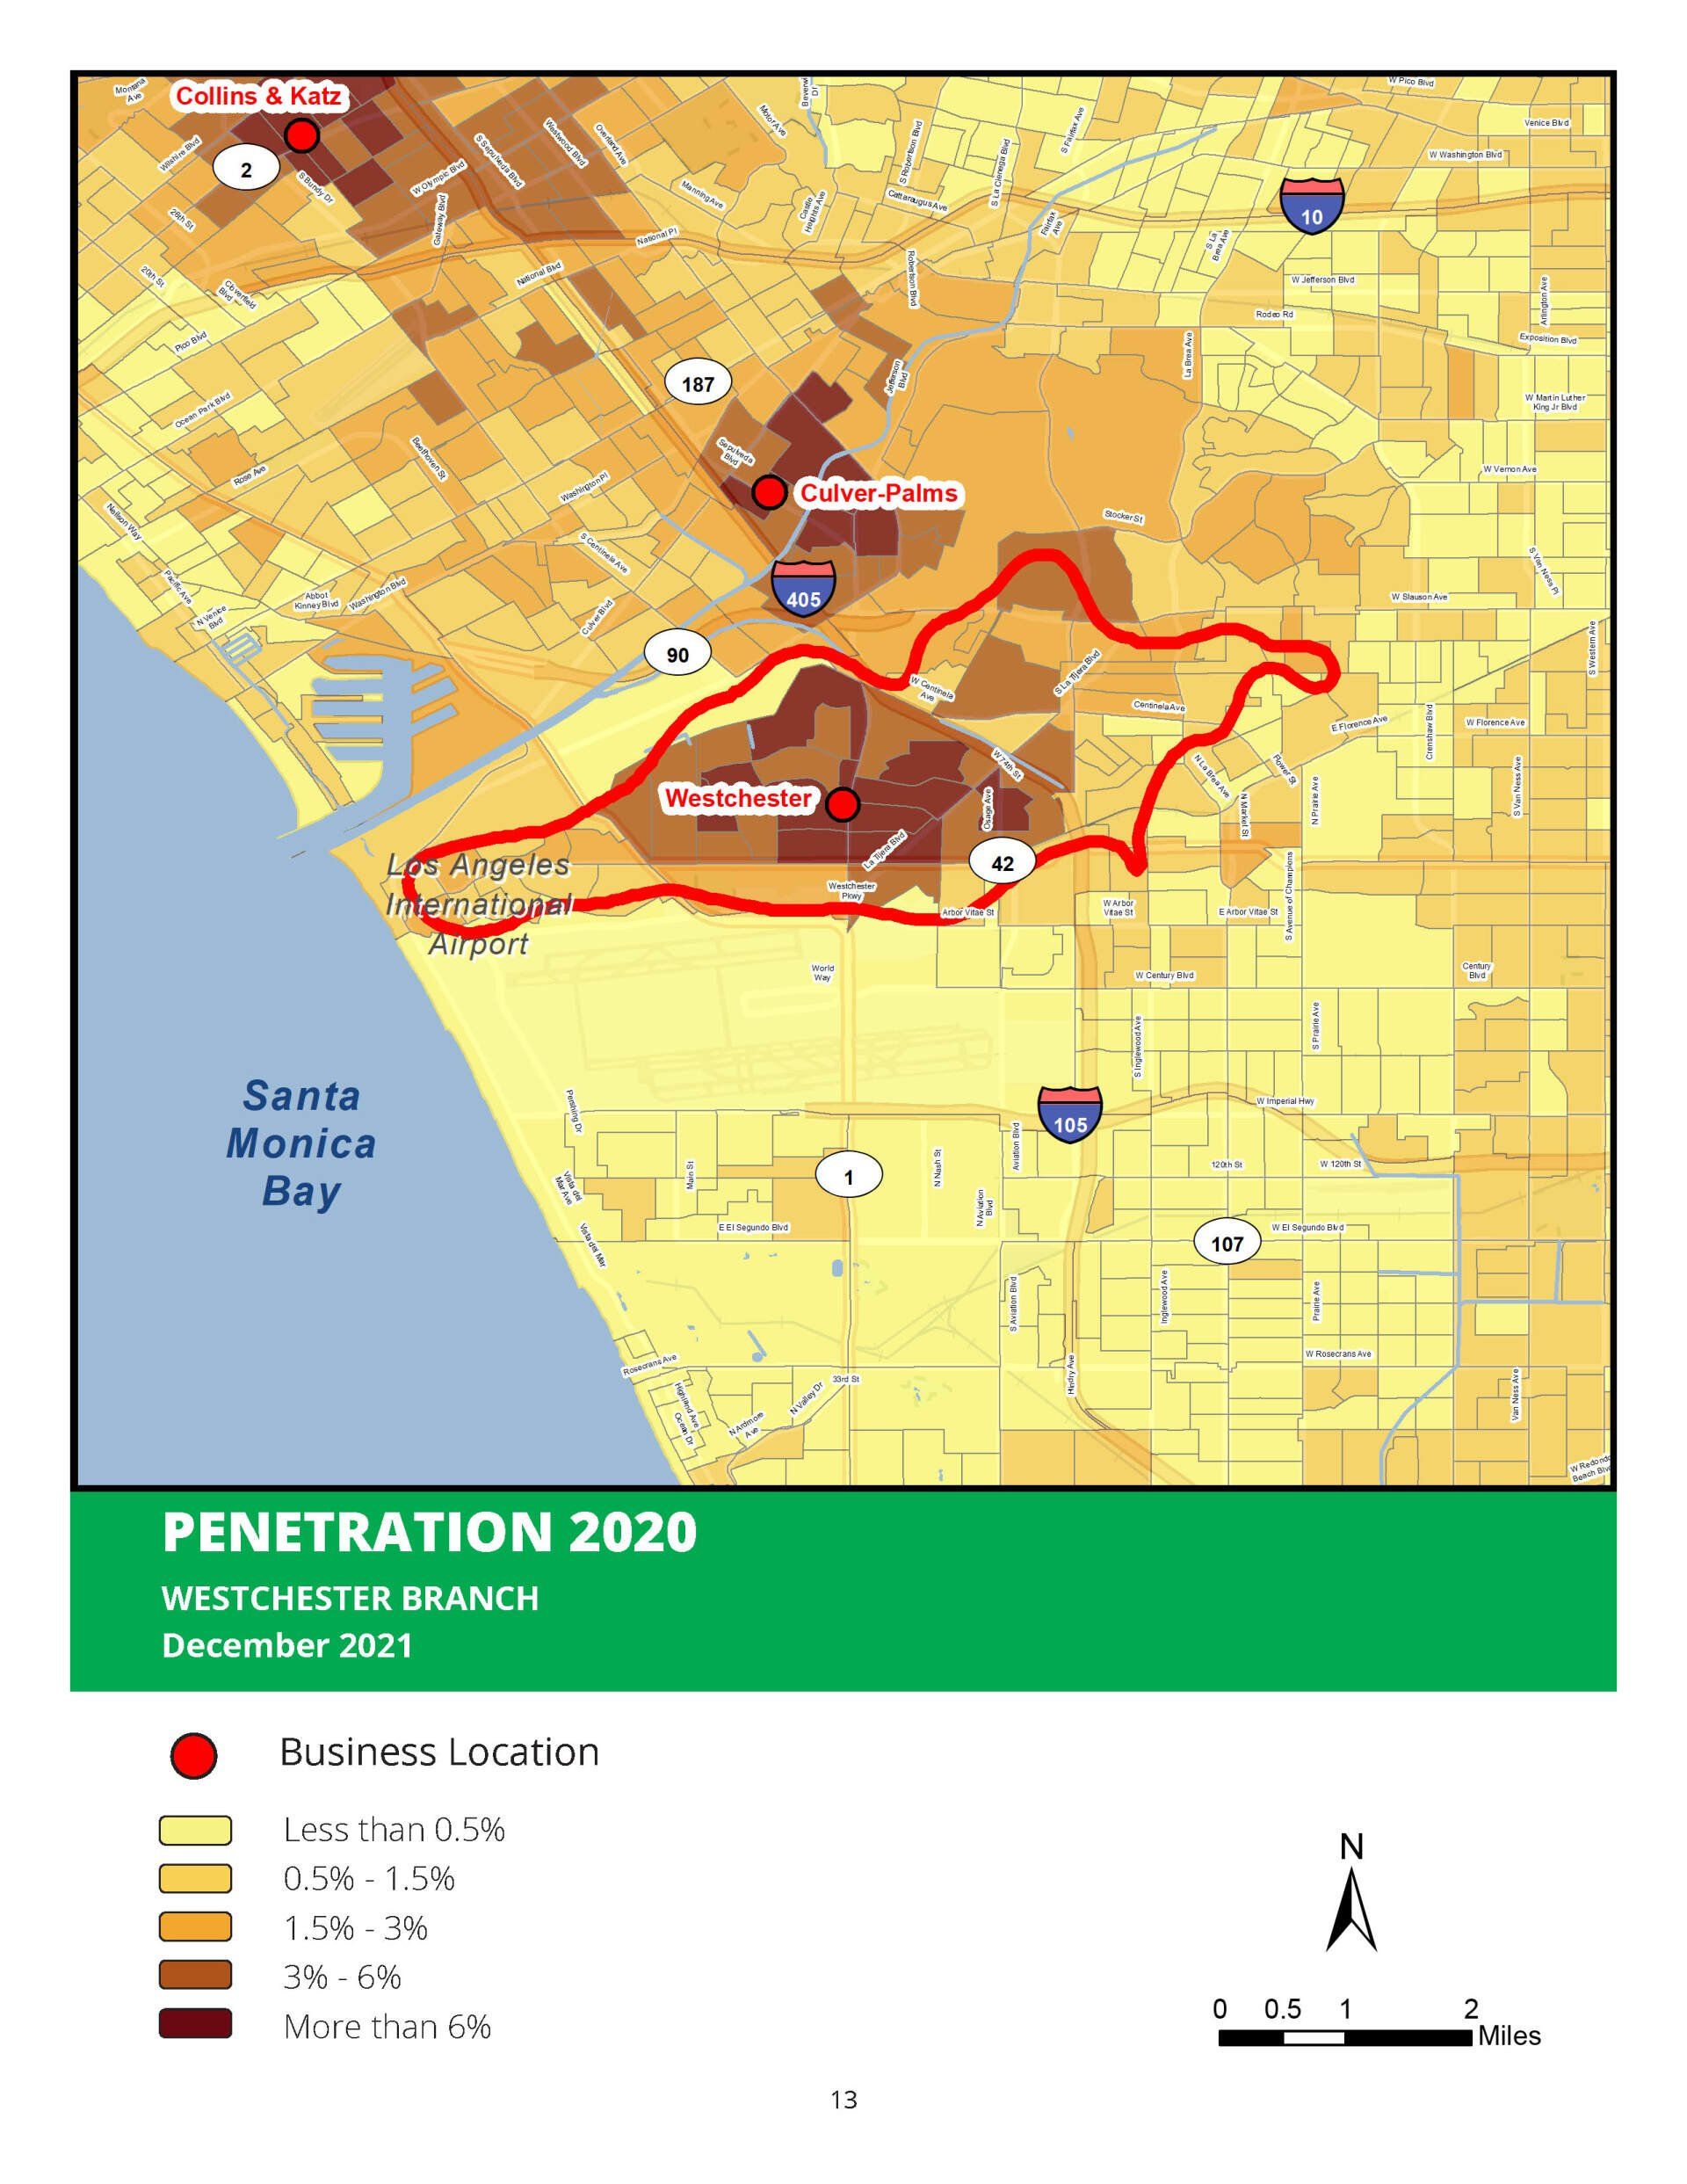
PENETRATION
The variable of Penetration is also reported in the thematic map format. As with the other thematic maps, its very easy to see that the business has higher penetration around the business location. We also begin to see pockets in the market area that have lower penetration. This creates areas of opportunity.
As a reminder, Penetration is defined as the number of client households in a neighborhood, divided by the total number of households.
MARKET AREA OVERLAP
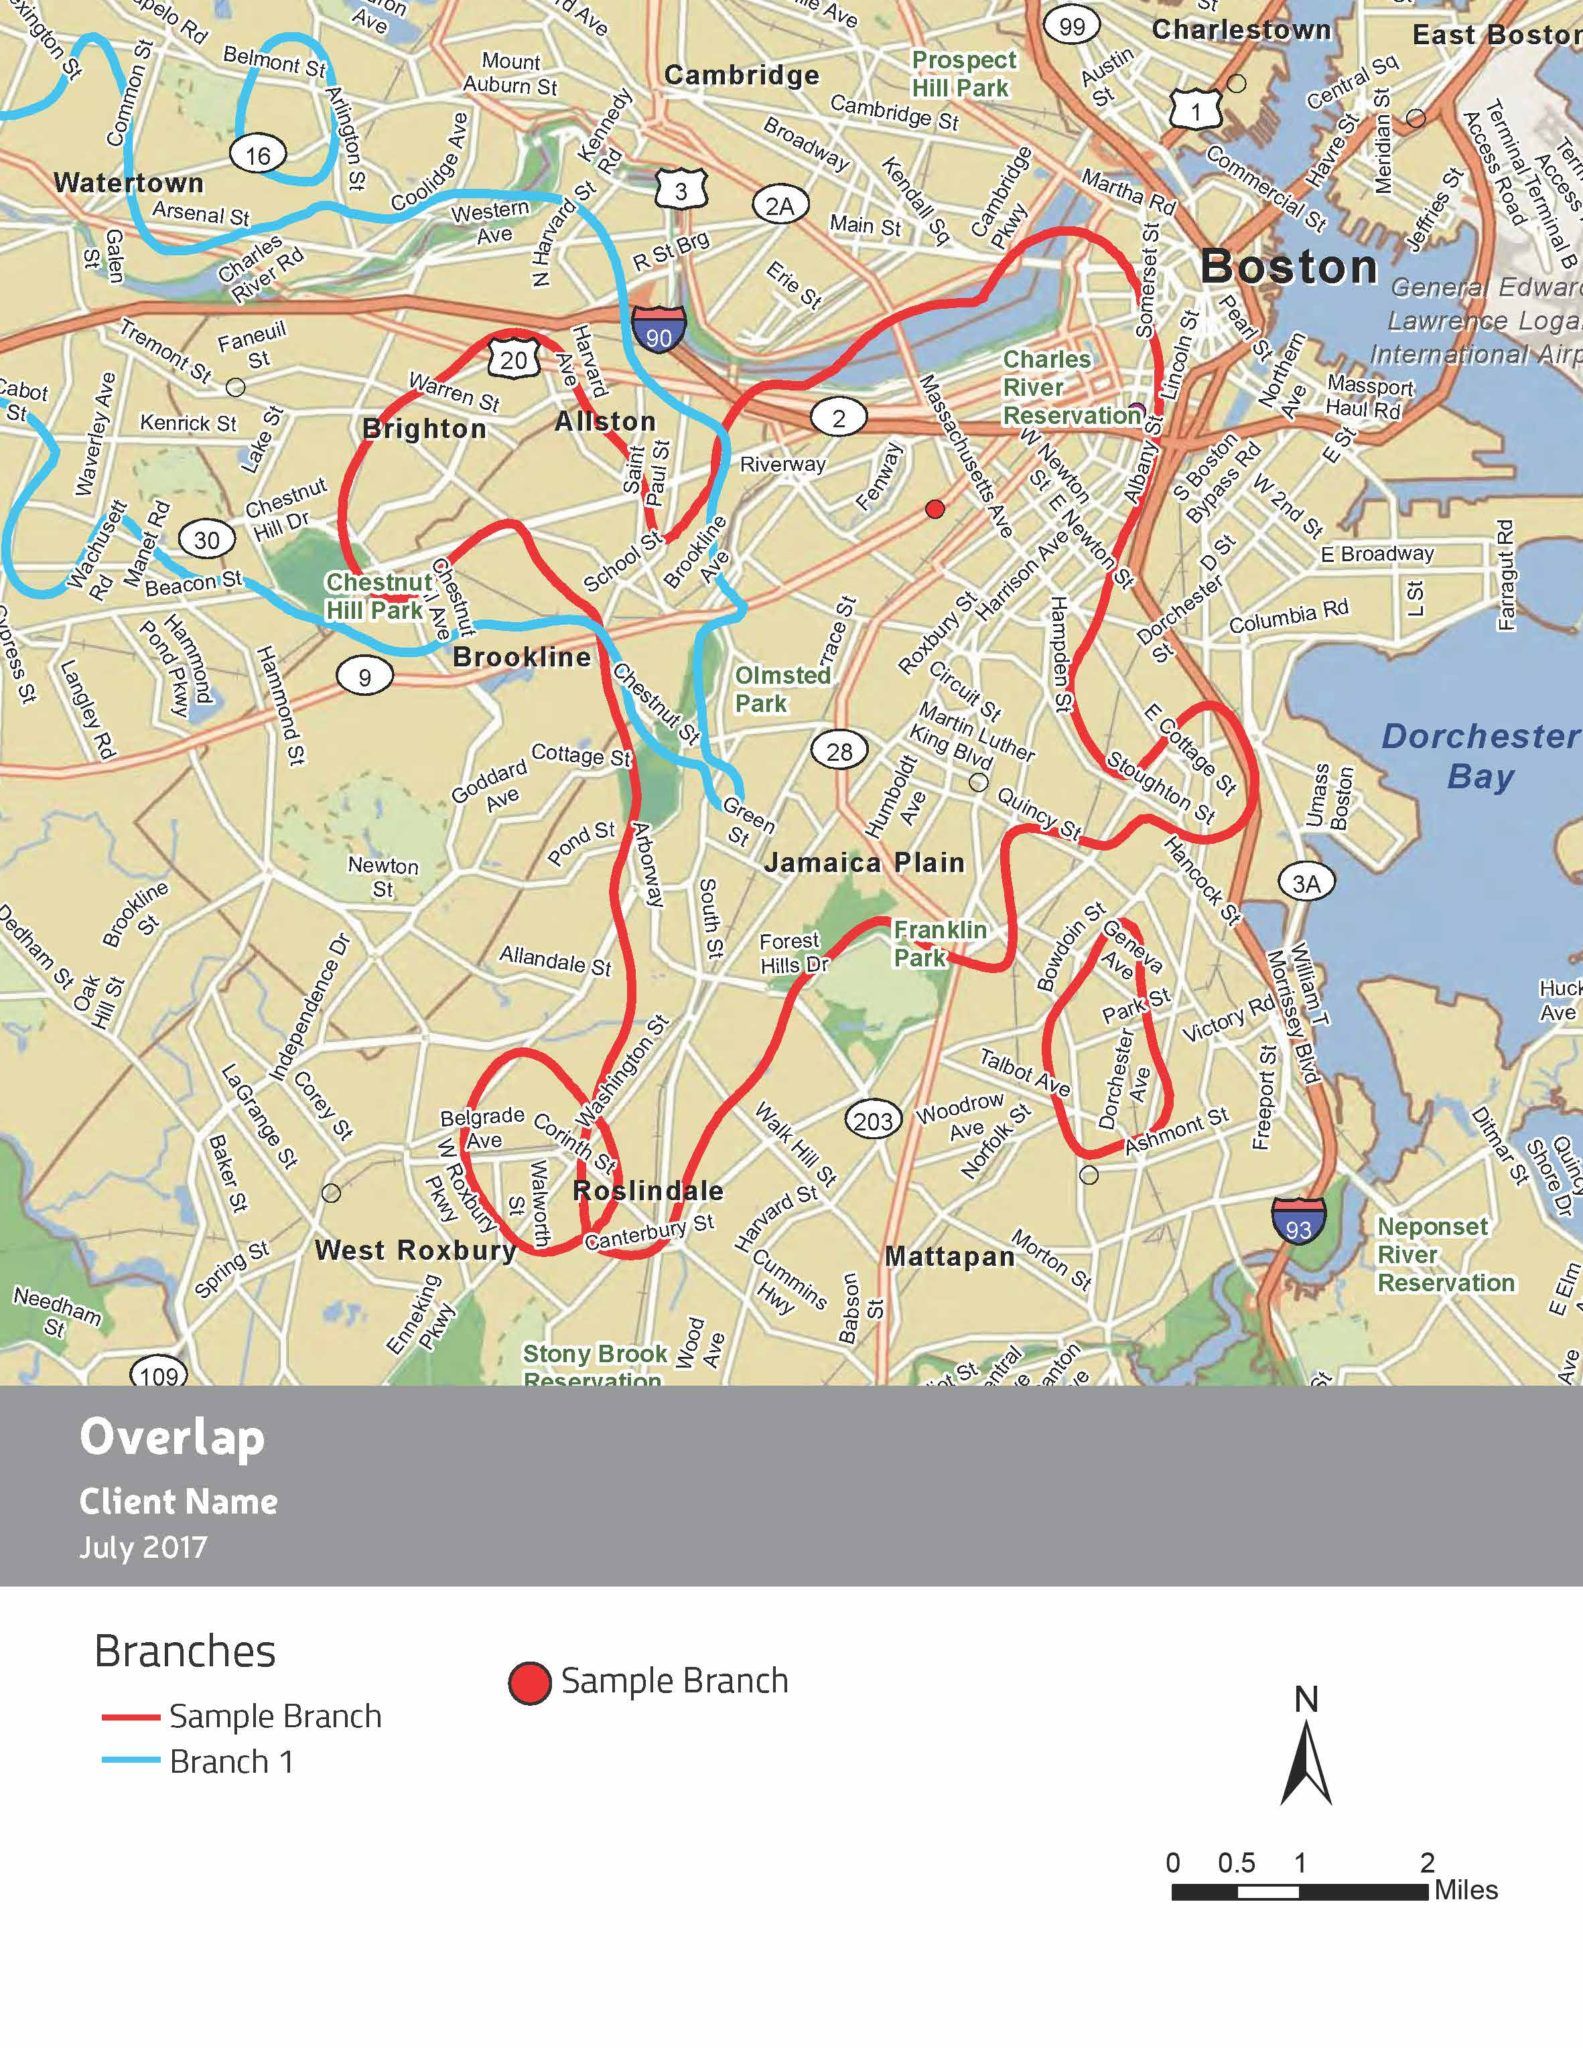
If your business has more than one market area that has been purchased, then Insightful Markets will report the multiple market areas on a single map, so that you can get an idea of how the market area boundaries overlap.
Market Area Overlap is important to understand when looking for new site opportunities, or when there is a concern of product cannibalization.
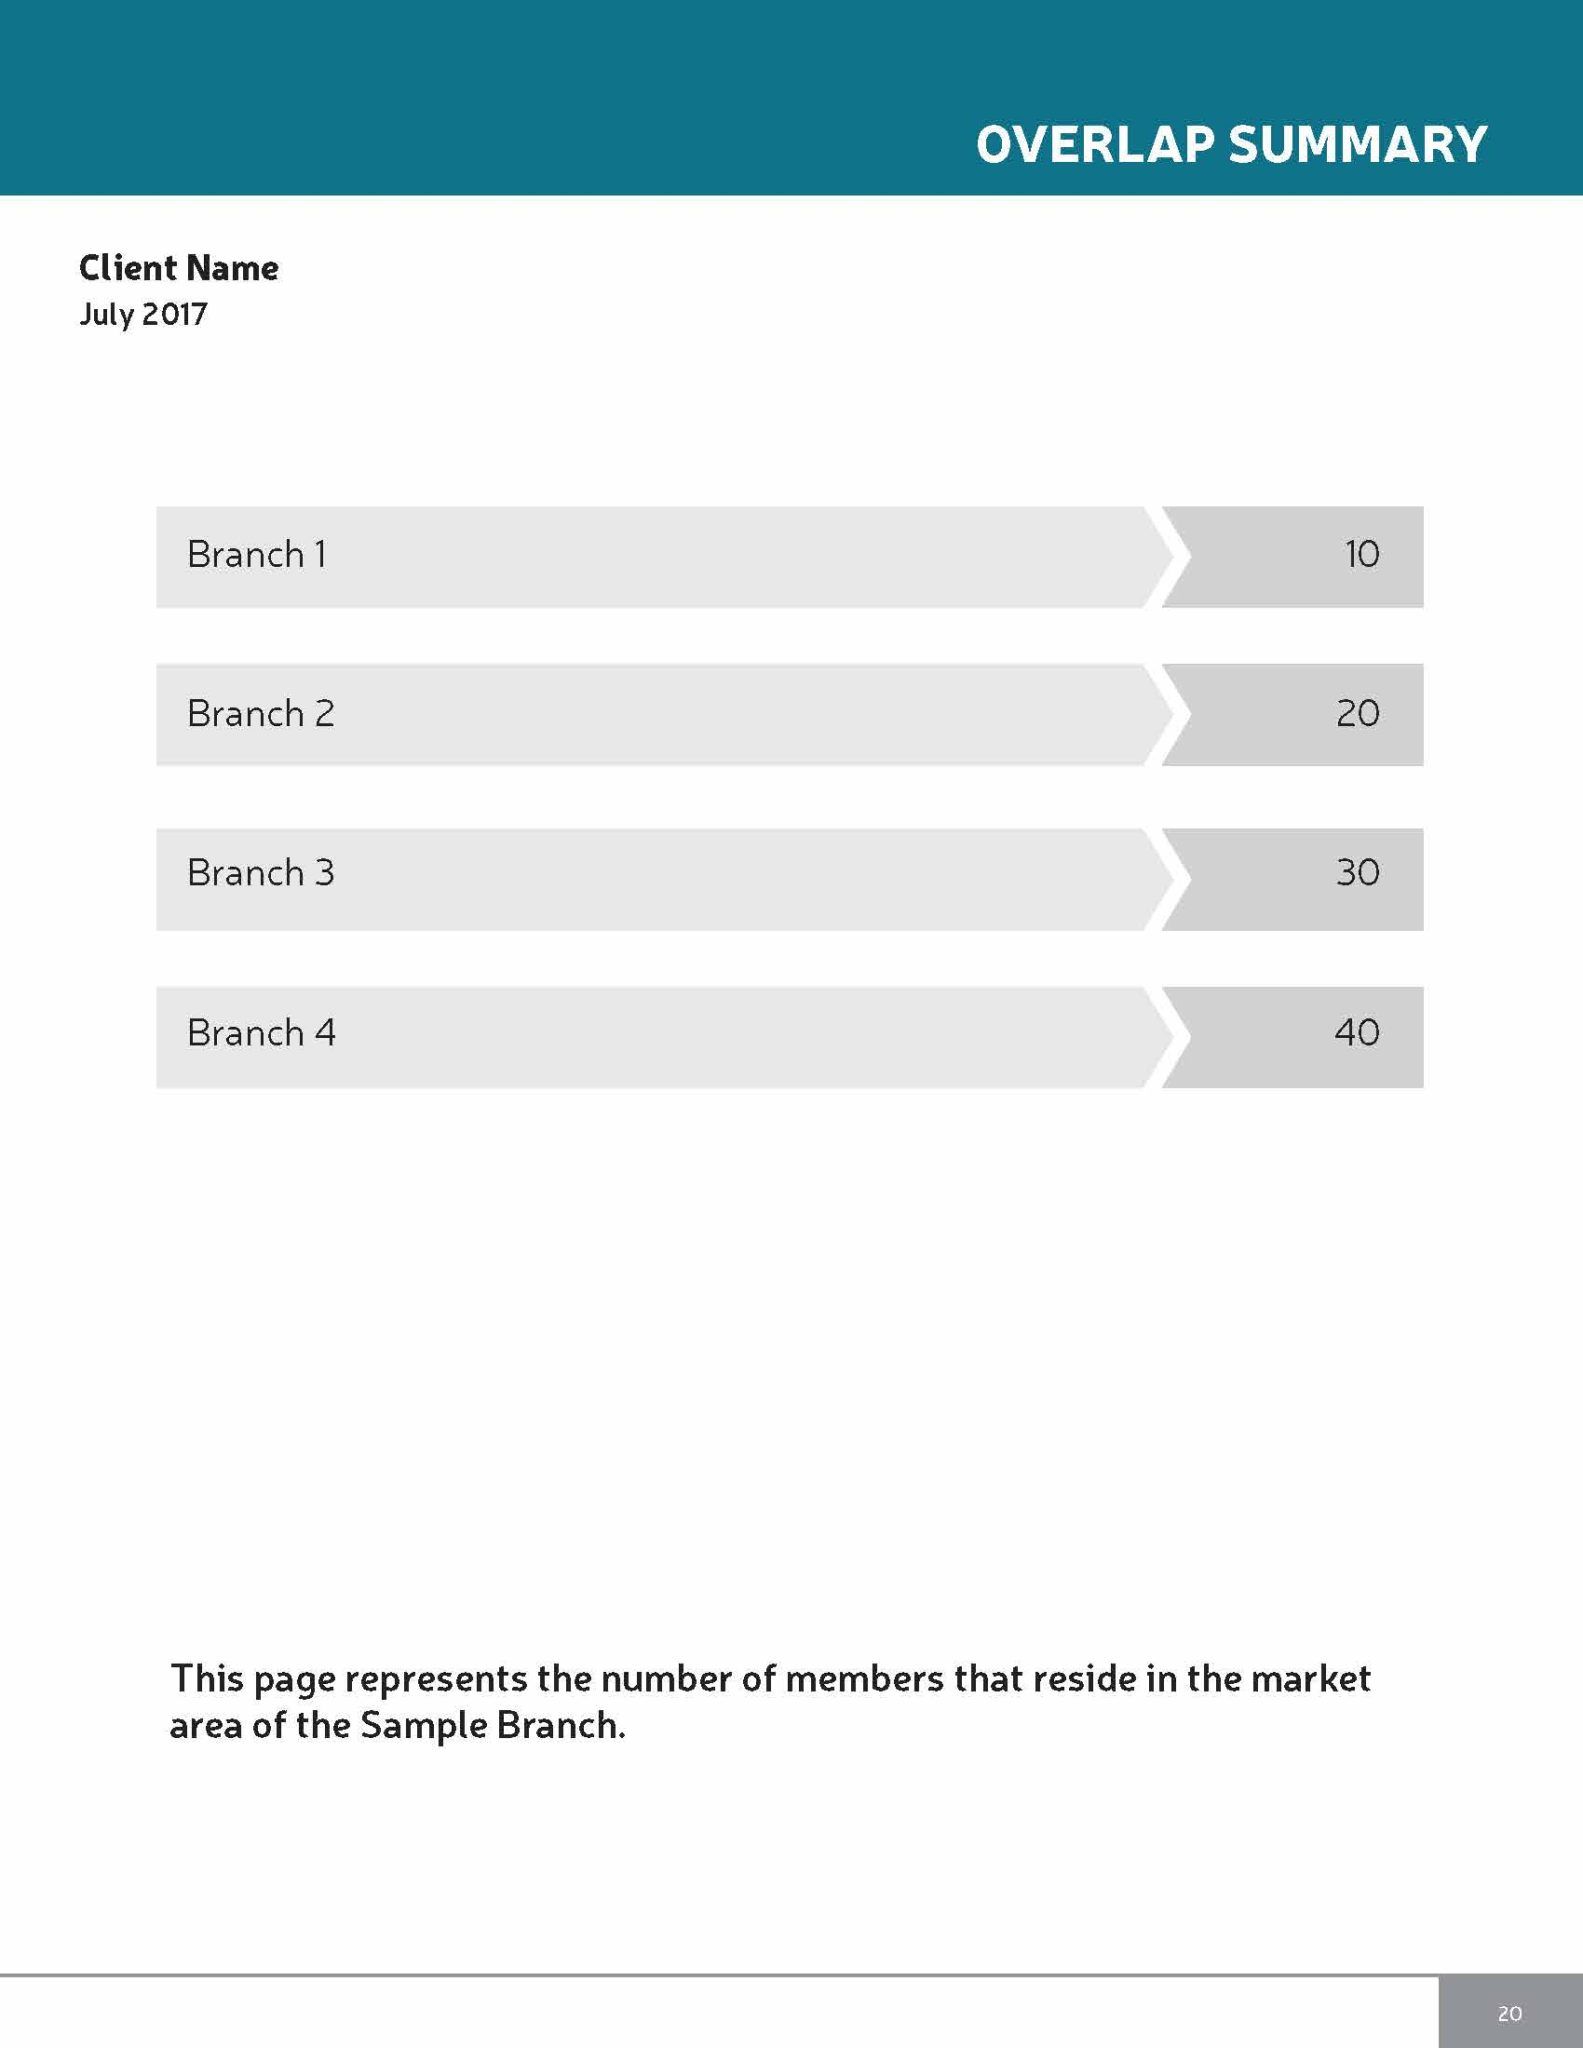
OVERLAP SUMMARY
The Overlap Summary reports the number of clients of the location being reported, that reside in the market area of another business location.