How to define the market area of a business can be a rather tricky, subjective, and important subject. A lot of marketers believe that the market area is defined by a set of zip codes that are closest to the business location, or they believe that a network of major roads lets them know where to target. The issue with guessing or subjectively defining where to target your efforts can lead to extreme waste of the marketing budget. If a marketer doesn’t know where their customers live, how can they target new ones effectively? For this post, I would like to look at how MAR (MarketAreaReports.com) uniquely defines a business’s market area.
First First! If its not clear why its important to understand your market area, check out my blog post – The Importance of Understanding where Potential Prospects live. Or Knowing your Market Area.
The first step to defining a business’s market area is to plot their current clients on a map. I italicized the word current, because for some companies, the list of customers can go back a long way. We generally want to plot, those customers that we believe currently visit our location, or would come back to our location within a reasonable amount of time. For instance, if I owned a pizza restaurant, I would not want to plot, those customers that I have not heard from in 3 years. If your business does not have an “active” client designation in its database, then my general rule of thumb is to go back 1-2 years, or up to 1,500 unique household addresses – though the more the better. Once we’re confident that we have an accurate representation of our current clients, then we’ll want to plot them on a map. I always say, plotting your customers on a map is a relatively easy thing to do, which can reveal all types of geo-spatial patterns that were previously hidden.
After we plot your customers on a map, MAR will apply our custom algorithm for defining a market area. Lets be clear, plotting your customers is a very worthwhile task, but it can have some inherent issues. Take for instance the map below:

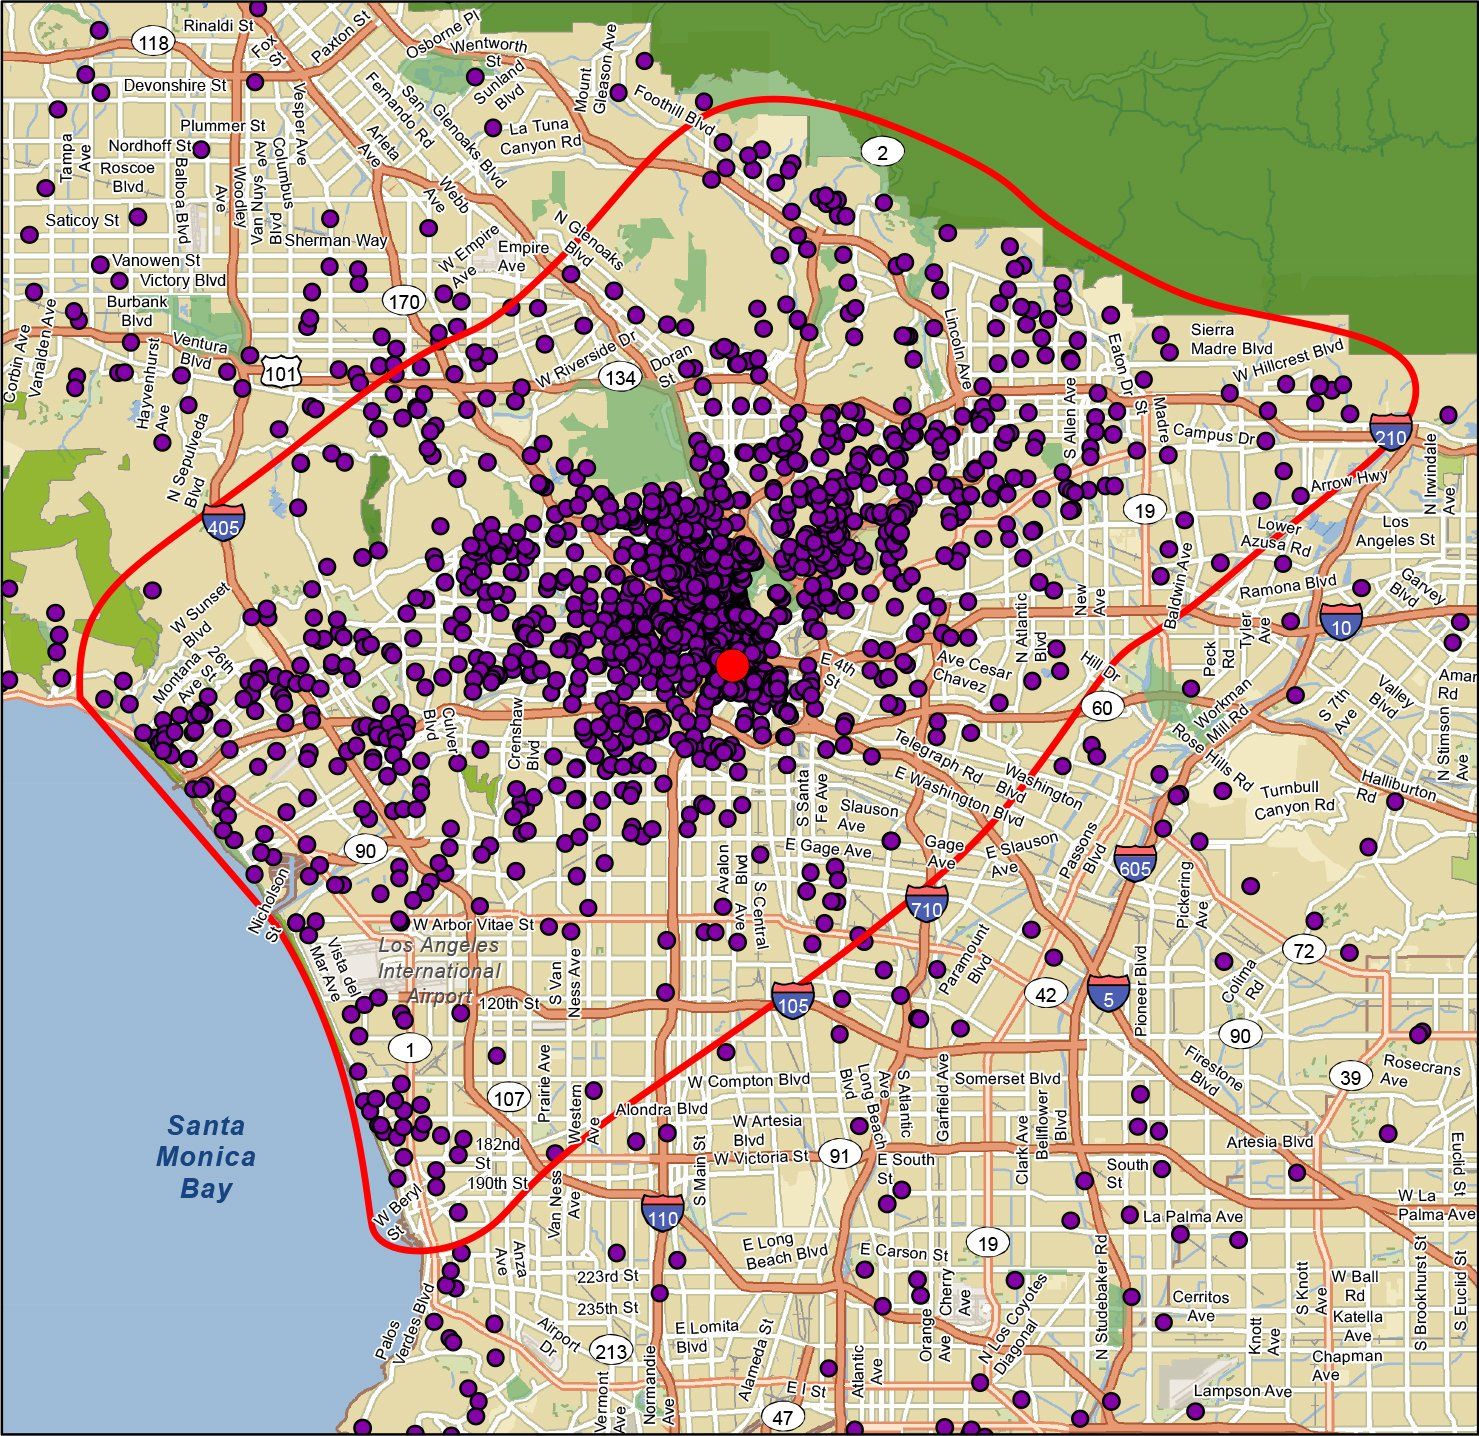
When you look at this map, you can see that there is a pattern to where the clients live, but its not totally clear how to use this information (or even where the market area is), until we put a boundary around it:

This is one of the main functions of the market area report – to define your market area. After you see the boundary, where to focus the marketing efforts of the business, everything becomes crystal clear – inside the boundary! The fact is that you’re 90% more likely to attract a new customer from inside your market area. I’ve made this statement a number of times, and its true in the simplest form. If, using our proprietary models, we draw a boundary around where 70-90%of your clients live, then its only obvious that you’re more likely to find a new customer in the market area. Lets face it, if 90% of your customers are in the market area, what are the odds that new customer will not come from the market area. Right, only 10%!
I know what you’re thinking, “boy, there sure are a lot of clients all ready in the market area. Why not try to go outside the market area boundary?” This is a very true and legitimate statement, but the fact is that most businesses only tend to have anywhere from a .5% up to 5-6% penetration. That means that roughly 95% of the households that live around this business are NOT clients. Given that fact, we need to Fish Where the Fish Are!
Another, point I would like to make about the market area boundary is that its defined using math, which is fact-based. There’s no guessing. If you truly go back and look at the first map, its hard not to see where the boundary is now, because you’ve seen it, but try to imagine you never saw it. Would you be able to draw a line around the client base? Probably, but most definitely, it would be more circular in nature. Our models draw shapes that tend to look like amoebas – why? Because clients live all over the place, not in perfect circles. So, if our clients don’t live in perfect circles, why do marketers solicit business from perfect circles? It doesn’t make sense!
Lastly, I’d like to point out that the market area boundary tends to expose geographic patterns that we may not have previously seen. For instance, in the above report, we notice that the boundary almost perfectly follows the interstate on the map, though there are clients on the east side of the interstate. Why is this? Because the model for defining the boundary, has figured out that a very low number clients live east of the interstate, though the model has no knowledge of the interstate at all. Its more the relationship of the location of the clients. It also has drawn a perfect boundary south of this business location, which is this case happens to be water, but again, the model knows nothing about the water at all. It only knows that there are no clients living in this area.
There are many applications for defining and using a market area. Check out my other blog posts for some interesting thoughts on spatial research. If you have any thoughts or questions, I would love to hear them. Feel free to email me today.


