Not All Market Areas are Created Equally
BY:
Jason Routman
April 1, 2022
In my post entitled “Knowing Your Market Area,” we discussed the importance of knowing the market that you serve. For this post, I wanted to take a look at a few different ways that research firms think about defining a business’s market area, and what differentiates MAR (Market Area Reports) from the other firms, because not all market areas are created equally!
A few years ago, I did a study for a major health club in Los Angeles, whose name we’ll call MHCLA. They came to me because they worked with another firm on defining their market area, but they had a major issue. The area that the firm focused on was much too big for MHCLA to put any reasonable actionable marketing plans together. See, the city of Los Angeles is somewhat unique from an analytical perspective. LA has a large population, it’s very dense, and it covers a very large area. The location that we were analyzing was the downtown location, versus one in the suburbs, so the reach of this location was huge. The challenge was to see if we could contract the market area, to remove parts of LA that the downtown location would never try to solicit clients from.
The firm that we were replacing, sold MHCLA on the ideology that a market area is defined by the location of exactly 80% of their client base. They, who will remain nameless, call the product a PMA, short for Primary Market Area. The idea of finding 80% makes sense in concept but has a number of inherent flaws. Example, if we mandate that we find exactly 80% of the client base, what happens if the clients live too far apart, or there aren’t very many of them? The model will stretch over neighborhoods and areas that aren’t truly part of the market area. This flaw becomes even more apparent when analyzing a location of a business that’s located in a downtown area. The reason being, if you center the business on the map and plot the clients, one of the first things you’ll notice is that a decent percentage of the dots, won’t be clustered around the location – why? Because they live outside of the downtown area. The idea behind drawing the market area boundary is simple: identify the areas/neighborhoods that your business has a higher than average client density. If my model has to stretch to find 80% of the client base, and only 60% of my clients are clustered in a meaningful way around the location, we’ll end up drawing a boundary around neighborhoods where our marketing efforts will be less than optimal.
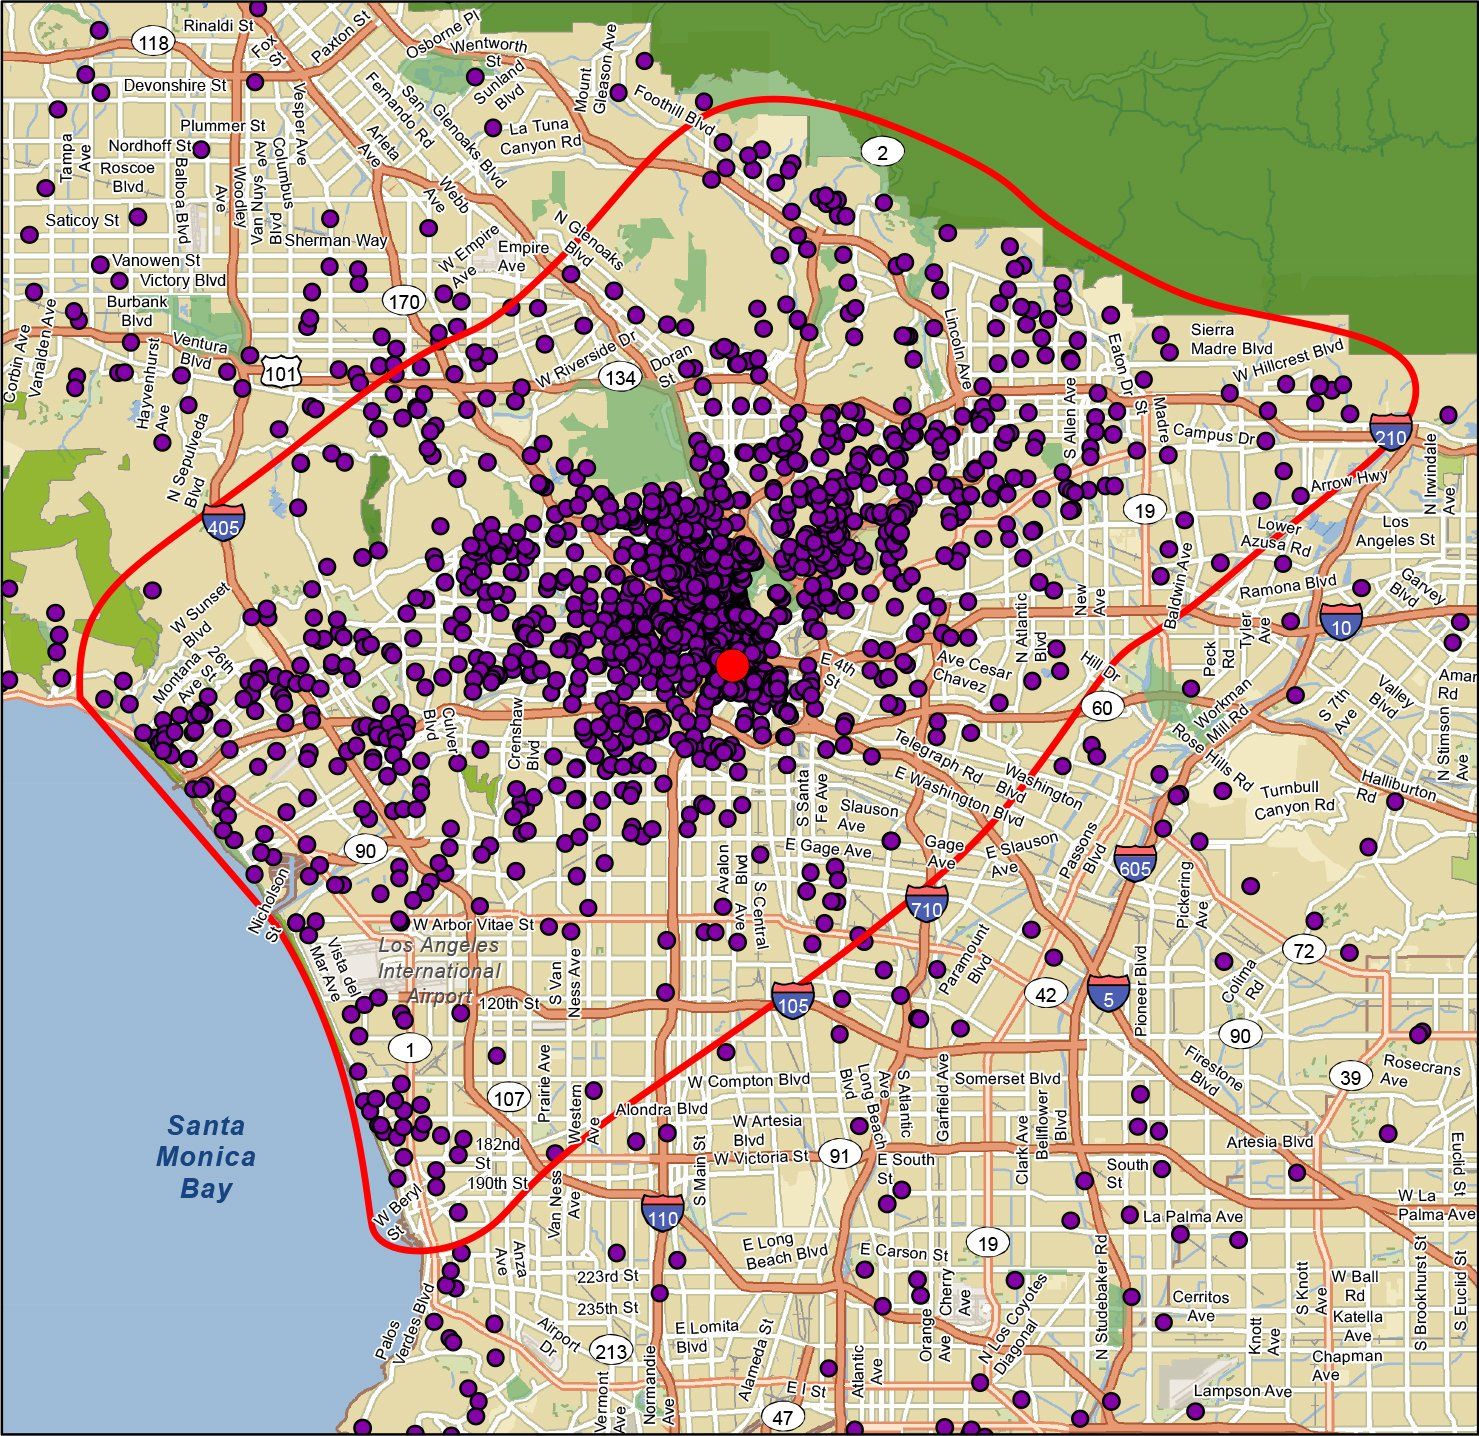
Take the market area on the left side of the boundary of Figure A above. It is the result when we use the 80% rule (note this boundary is a representation of finding 80%, it is not the competitor’s reported market area). The first thing that we notice is that it’s huge, it spans nearly all of Los Angeles. The market area statistics tell us that it’s over 450 square miles and covers well over 1.5 million households. The question is… visually we can see that there is definitely a cluster of clients that live near the location. So what happens if we get rid of the 80% rule, and focus on the clients around the location?
The market area in Figure B below is the result of breaking the 80% rule and drawing a market area that’s much more compact – one that’s based on the true, non-contiguous client density. One can see that we’ve drawn the market area around where the clients are clustered. Its true, we have reduced the percentage of clients in the market area down to 63% – a reduction of 21% — but what about the overall area and households? Our new market area is only 61 square miles and 448,308 households- we’ve cut the square miles by nearly 9 times, and the number of prospect households by 3 times! Subsequently, though we cut the number of clients and households in the market area, we’ve still displayed efficiency, as we have increased the overall location market area penetration by 50%.
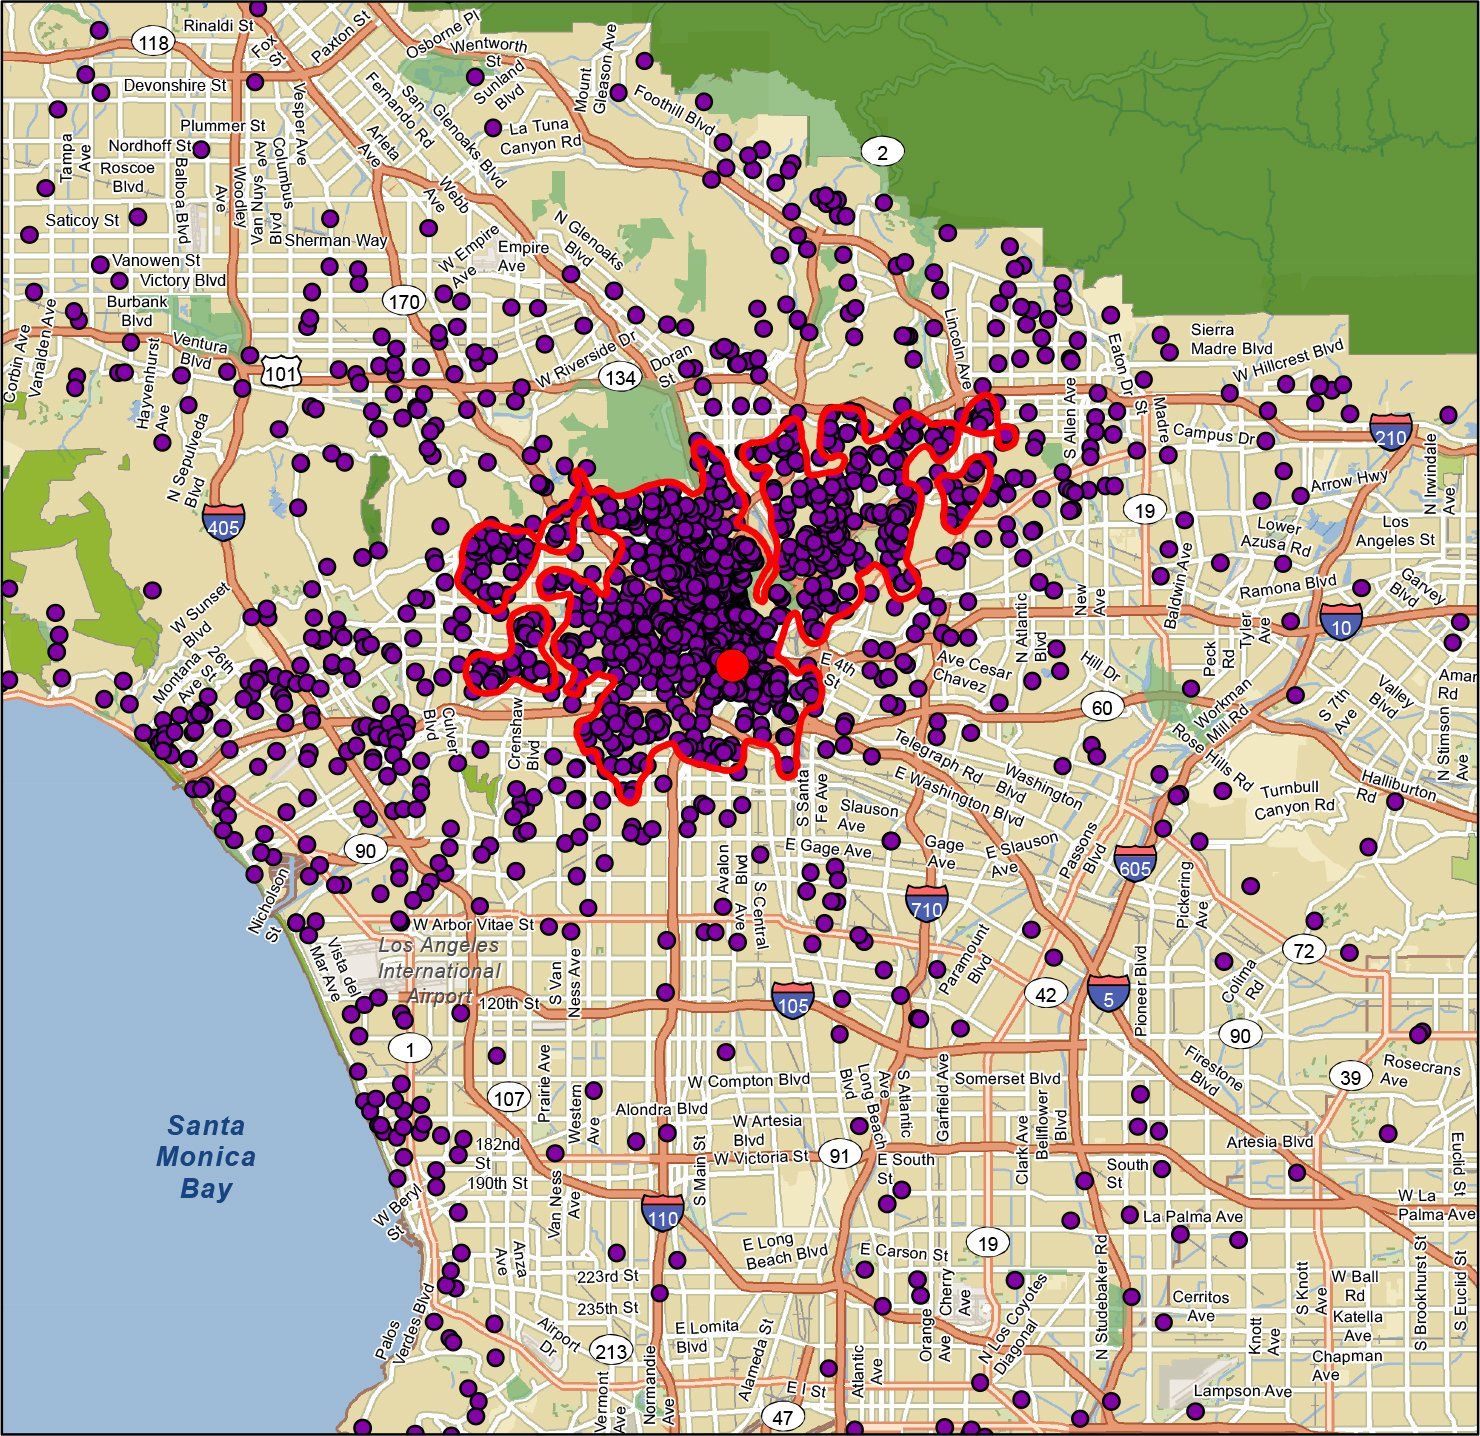
Another issue with the other PMA reports is that they always display contiguous market area boundaries as well. This is another major flaw. A contiguous boundary means that it is one single shape, instead of multiple shapes. By employing our MAR’s method of non-contiguous or multiple shapes, we can effectively and efficiently draw boundaries around individual areas or neighborhoods.
Let’s reason more a moment – anyone that’s familiar with the neighborhoods around the neighborhood in which they live, knows that the demographics of nearby neighborhoods can be drastically different. For instance, I live in an upper-middle-class neighborhood, consisting of a high percentage of established families and near empty nesters, I also know that directly across the street from the entrance to my community there is a group of low-income houses, as well as trailer homes. It so happens that this lower income area can be closer to the health club I visit by distance than my own neighborhood. So, if I force my market area boundary to be a single shape, and I need the clients in my neighborhood to get to 80% for reporting, what’s going to happen? Correct! We’re going to suggest that the low-income neighborhood is part of the market area when we know it isn’t our target in the first place.
To further elaborate on this point, I know the neighborhood across the street is low income and not part of the health club’s market area, but imagine all the neighborhoods I don’t know about. This is where we must rely on the models to analyze client location clustering to identify the real neighborhoods in my market area. Remember, the market area boundary is going to make specific suggestions about where to target. We don’t want to waste a nickel on soliciting bad information, and we want to get the highest ROI we can get from our nickels we are spending.
As you can see, we have a smarter way to analyze your market. Feel free to contact MAR today if you have any questions about how our market areas are created. You will be surprised at the stuff we can find, and how much more you can do to create more personalized marketing strategies that will attract the attention of those really potential prospects in the neighborhoods you are targeting.
Read more...